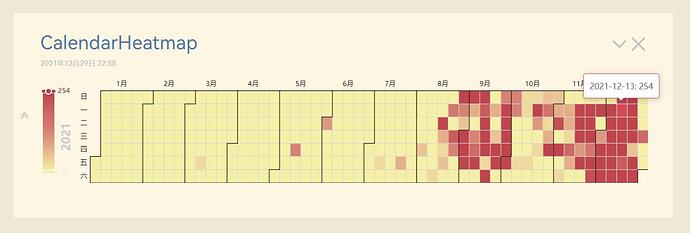
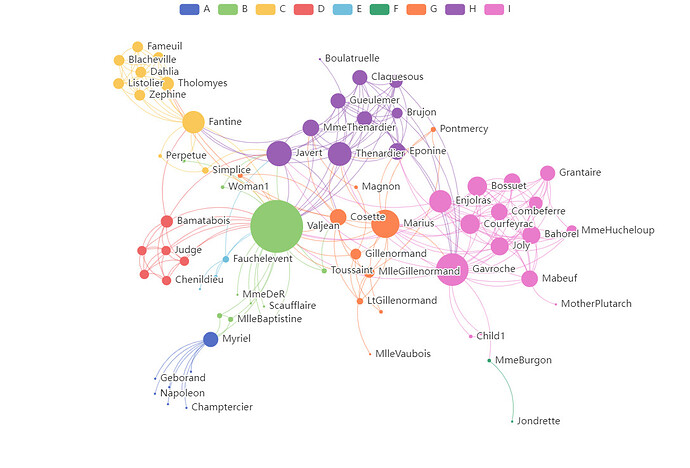
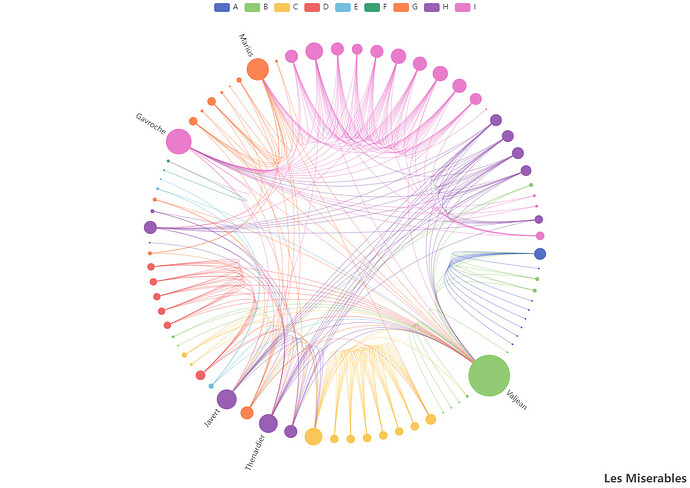
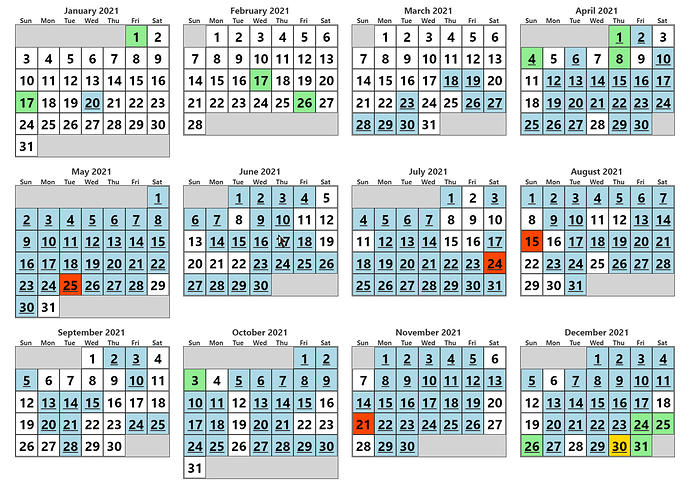
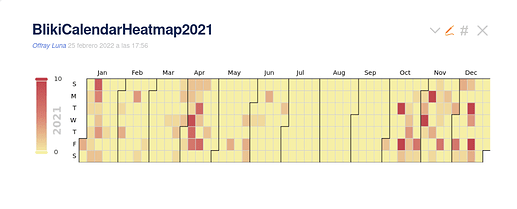
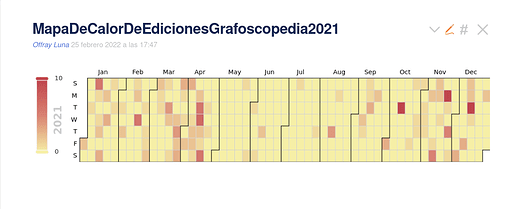
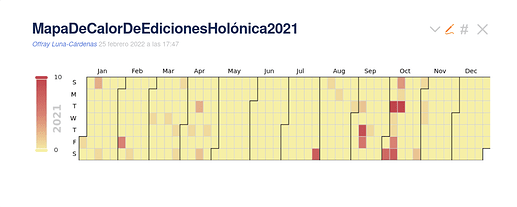
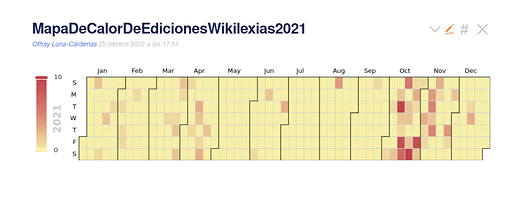
@Sttot developed a very versatile visualisation library ECharts — Awesome Visualization Library for TiddlyWiki5, and I make a calendar heatmap that shows the number of Tiddlers created or edited each day using it.
Calendar heatmap can count the number of tiddlers created or modified by users this year by day.
How to use:
First install Echarts, then download and drag the following CalendarHeatmap plugin into your TiddlyWiki, and finally refresh it.
CalendarHeatmap.json (1.7 KB)
It would be nice to give Echarts a star GitHub - tiddly-gittly/tw-echarts: An All-in-one Visualization Framework for TiddlyWiki5 based on ECharts .
