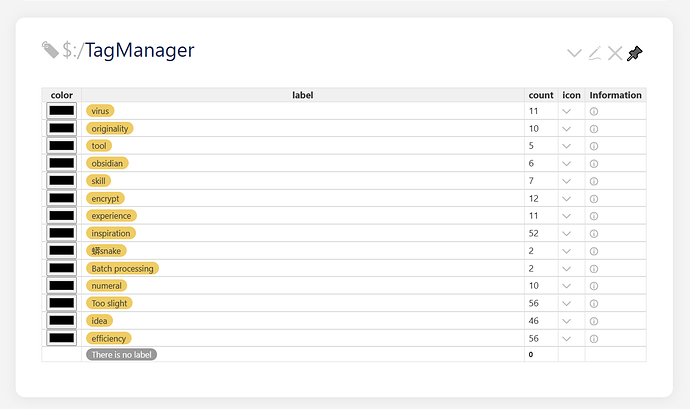
Generate a pie chart based on the number of label references in tiddlers

This can more intuitively show the proportion of various tags in a personal tiddlywiki, so that you can clearly know how to balance tiddlers, which tiddlers to promote and which tiddlers to forget. Optimize and reclassify the reference tags of tiddlers that have a very small number of tags

Any reply would be greatly appreciated

I don’t have the solution you’re looking for, but I’d gently suggest that a pie chart may not be a particularly useful visualization in any wiki with more than a couple dozen tags. For reference, tiddlywiki.com currently uses 409 tags in total, or 394 if excluding system tags like $:/tags/Stylesheet and $:/tags/Macro. This means most of the pie slices are going to be illegibly tiny.

Instead, you might want to try a tool like @EricShulman’s Tag Cloud, or @Charlie_Veniot’s approach shared here: [tw5] Tag Cloud (TiddlyWiki coding fun). Either will give you a similar proportional view of the relative “volume” of each of your tags.

1 Like

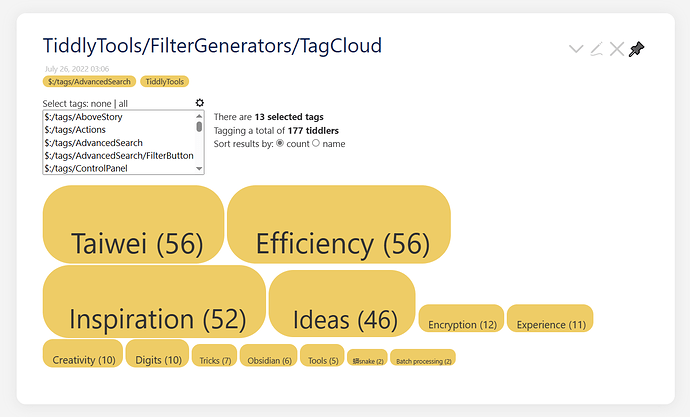
Thanks for the idea, word cloud might be a visualization scheme for uncountable label statistics

This is a visualization scheme using the word cloud scheme


It seems that this proposal works better when the tag number is a countable noun, Using pie chart

Please note that FilterGenerators — TiddlyTools: "Small Tools for Big Ideas!" (tm) is obsolete, and has not been updated since 25-July-2022. All TiddlyTools add-ons are now hosted directly on https://tiddlytools.com/, rather than in separate files.

The latest revision of TiddlyTools TagCloud is here: TiddlyTools/Search/TagCloud

-e

4 Likes

I think one of the potential problems in using the number of tags (or backlinks) as a measure of value is that as a Wiki grows larger the number of tags or links on a particular tiddler may be dependent on it’s age. It obviously depends a lot on what the wiki is used for but personally I find I am continually adding links and tags to old tiddlers - for instance ones that were created before I created a particular tag. I prefer to keep the number of tags down (currently over 300) and so I don’t usually create a new tag the first time I think of it as a possibility - I wait and see how much demand there is for it.

1 Like

Look at Visualization Dashboard plugin in development. there are some examples, you can copy some and apply your custom filter.

1 Like

I am now in the preliminary stage of perfecting my knowledge base, I will subconsciously not add tiddlers as its tags for a tiddler, at most I will refer to the tiddlers with text points. I have made extensive notes on obsidian notes and typora before. It is often very difficult to update and maintain a knowledge base after creating multiple repositories. Although I do not care about them anymore, this has made it very easy for me to transfer my note-taking skills to tiddlywiki, especially in the updating and maintenance of tiddlywiki knowledge, which has led me to deliberately avoid creating articles that are closely related to each other. Instead, there is one and only one to make a note in each area. My idea with tags is not to let them become a burden to my note-taking, and I iterate on whether the tag name is appropriate, so much so that I now have an average of 1.9 changes per tiddler in my main tiddlywiki knowledge base

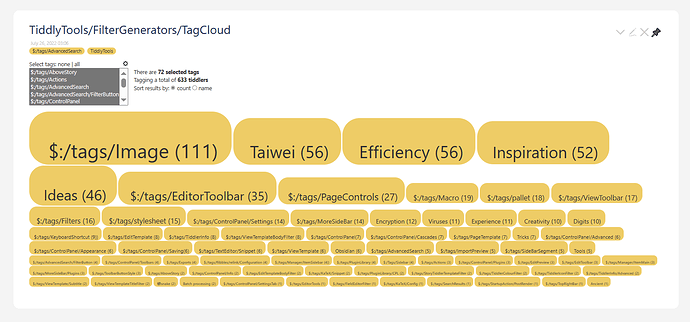
Combined with your development scheme, I remember that markdown syntax can draw pie charts, perhaps how can tiddlywiki filter and markdown pie chart syntax be closely combined, perhaps this is a solution to this topic

This can be useful

2 Likes