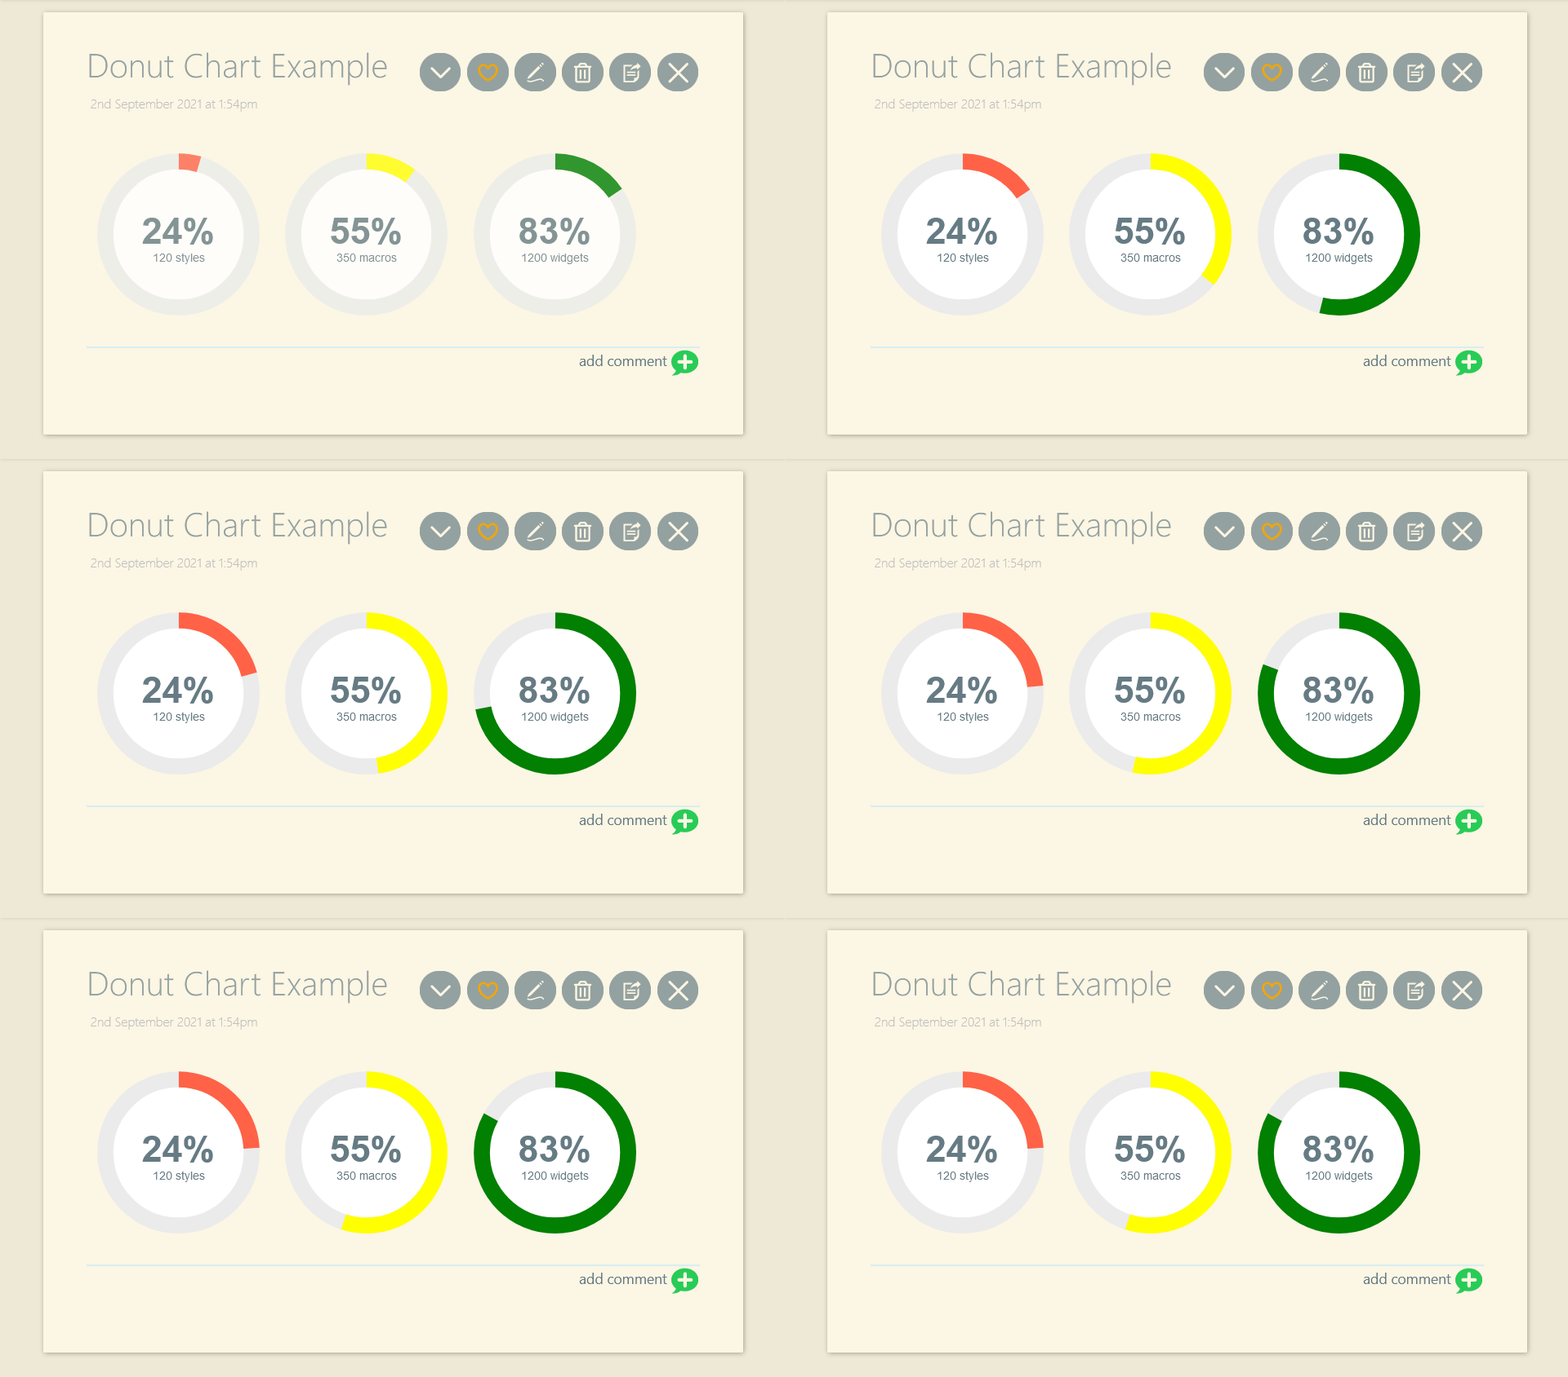
Referring to (Simple Progress Pie Chart in TiddlyWiki ) for creating pie chart in Tiddlywiki without JS and great comments from @Alvaro , @pmario and @sobjornstad here is a new solution for creating Donut Chart using simple SVG, CSS and TW macro.
This new solution is based on the great job by Jan Verstraete (https://codepen.io/janverstr/pen/PvPoaV )
download attached JSON donutchart.json (3.1 KB)
drag and drop into your wiki (for test use https://tiddlywiki.com/ )
open the Donut Chart Example . See examples and edit as you like.
To create a new donut chart just call the macro as below
<<donut-chart "pct" "label" "color">>
You can edit the stylesheet and remove the maximum width and create chart with customized size!
The following example uses the macrocall widget so you can pass calculated parameters to the donut-chart macro.
This will return the percentage of all standard tiddlers changed since the wiki was last loaded.
<$vars
total-tiddlers={{{ [!is[system]count[]] }}}
hascanged-tiddlers={{{ [haschanged[]count[]] }}}
>
<$macrocall $name=donut-chart pct={{{ [<hascanged-tiddlers>divide<total-tiddlers>fixed[4]multiply[100]] }}}  label="tiddlers changed" color=green/>
</$vars>
Remarks
This is a wiki post, interested user, edit and improve!
Rev 2 (Sep 2nd, 2021) modified to support Firefox
pmario
September 2, 2021, 10:30am
2
I did import it to tiddlywiki.com in FireFox and it doesn’t work. It shows 100% rings on all elements.
@pmario - I tested on Opera, Chrome and Edge all worked!
The reason was Firefox does not support calc() in SVG! While Chrome, Edge and Opera support this method!
pmario
September 2, 2021, 8:09pm
4
The new version seems to work with FF now. - Looks nice!
A question of precision
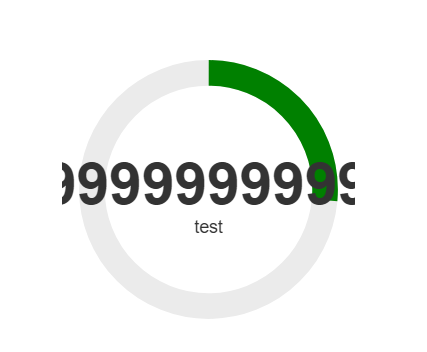
To simplify the discussion, I will give the corresponding numerical code directly and show the results.
<$macrocall
$name=donut-chart
pct={{{ [[2]divide[7]fixed[2]multiply[100]] }}}
label="test"
color=green/>
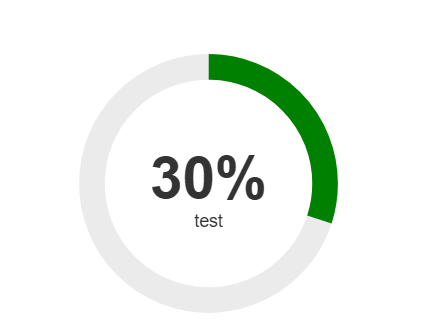
The above went wrong.Change the precision to 1 and it works.
<$macrocall
$name=donut-chart
pct={{{ [[2]divide[7]fixed[1]multiply[100]] }}}
label="test"
color=green/>
Can anyone tell me what this is about? What should I do to fix it? Keeping the accuracy to 2 is more accurate, keeping it to 1, on the contrary, is less accurate.
Hi @dongrentianyu
This looks like a CPU floating-point representation problem, see this wikipedia article about floating point arithmetic for a complete description of the causes.
This filter [[0.29]multiply[100]] also gives a result of 28.999999999999996.
But in your use case, you can avoid this problem by changing your filter to [[2]divide[7]multiply[100]round[]].
Fred
Donuts! Thanks to Mohammad I have to count my carbs even in TiddlyWiki!
thanks too much.i will read it .i use fixed[4],and it successed.
@Mohammad .donut-segment-2 fill and .donut-ring stroke to <> or something similar. But it is not working. Can you help ?