Timeline vis.js Kixam Emkay plugin: overlapping events

Hello,
I use the Timeline vis.js Kixam Emkay plugin vis.js Timeline — emkay plugin, reloaded like this:

<$visjstimeline filter="[tag[Tâches]][tag[Appels]][tag[Tutoriels]][tag[Réunions]][tag[Project]][tag[Vacances]]" persistent navpad endDateField="end-task" startDateField="start-task" groupTags="[[Tâches]][[Appels]][[Tutoriels]][[Réunions]][[Project]][[Vacances]]" boxing format="" tipFormat="DD/MM/YYYY HH:mm" config="Calendrieroptions">

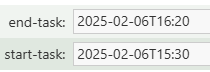
Fields on tiddlers :
image

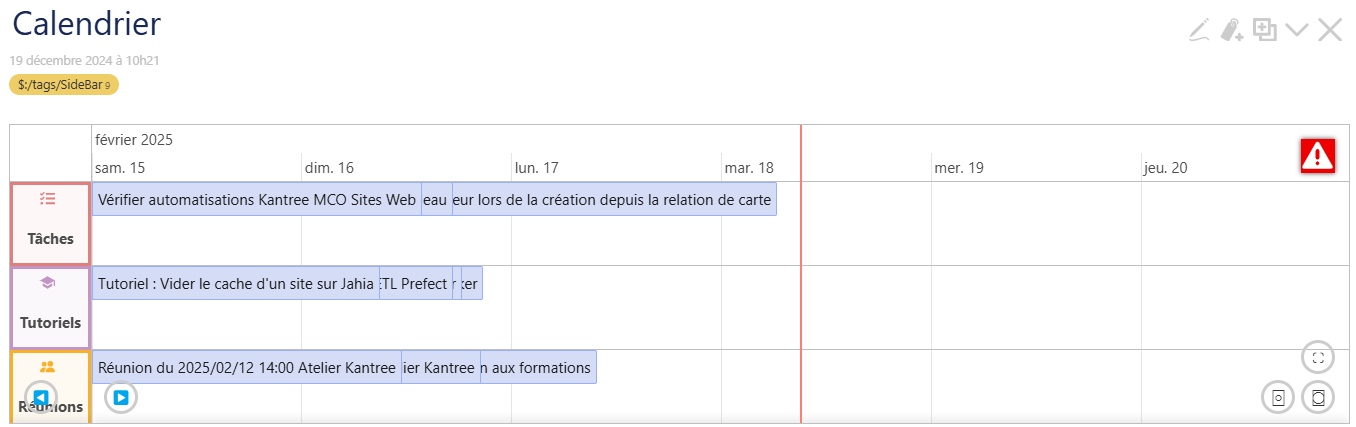
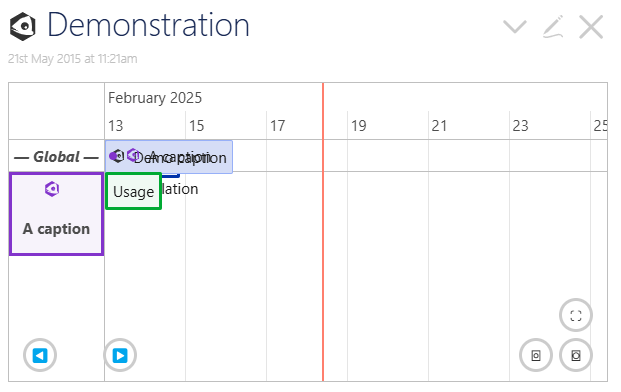
I’m disappointed because everything overlaps, even though the start and end dates are quite different. On the demo version, the problem seems to be similar:
image
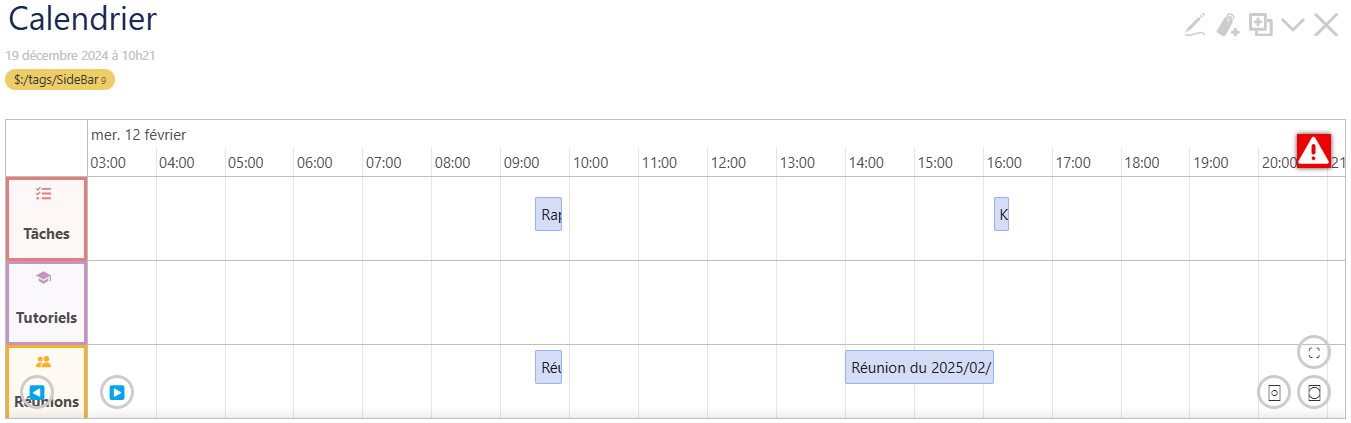
Sometimes, by zooming in and out, I manage to get a decent display:


I’d like to be able to specify the default display, for example the current day from 7am to 6pm. And especially to prevent events from overlapping.
I tried adding options but it didn’t change anything, I don’t know if the options are really taken into consideration. Sources : Anyone still use Emkay/Kixam vis.js Timeline? - Plugins - Talk TW and How to have Events appear not stacked in Emkay’s vis.js Timeline - Discussion - Talk TW

Any ideas? If you have another plugin to suggest, I’m interested.
Thanks

Does anyone have any ideas?

Have you seen this thread?

as an alternative time line plugin?

I put up a quick demo

https://knightlabsandvisjstimelines.tiddlyhost.com/

Hi Ste_W,

Thanks for this alternative! It works great. I tried using it by adding the following format to $:/plugins/oeyoews/timeline/widget.js with hours and minutes: “YYYY-0MM-0DDT0hh:0mm”:

    // Try to parse ISO datetime format (YYYY-MM-DDThh:mm)
    const isoDatetimeMatch = dateString.match(/^(\d{4})-(\d{2})-(\d{2})T(\d{2}):(\d{2})$/);
    if (isoDatetimeMatch) {
      return {
        year: isoDatetimeMatch[1],
        month: isoDatetimeMatch[2],
        day: isoDatetimeMatch[3],
	    hours: isoDatetimeMatch[4],
	    minutes: isoDatetimeMatch[5]
      };
    }

Overall, it works well, but there is a major performance issue. As indicated in the documentation, it suggests no more than 20 slides, but it has a lot of trouble working when there are several hundred.

To limit the load, I removed the slide display in CSS, but there is still a lot of latency:

<style>
.tl-storyslider,.tl-menubar
{
display:none!important;
}
.tl-attribution{
position:relative;
}
</style>

It’s also a shame that you can’t specify a start and end date for the display, just the years, and that you can’t adjust the default zoom.

Thank you for sharing this plugin and this demo. It’s interesting, and I’ll keep it aside to see how it develops.

1 Like

Might be a little late but @twMat has just published a Gantt chart plugin.