Any suggestions for how to visualize relationship between tiddlers?
I’m looking to accomplish something like the graph view in Roam or LogSeq.
I am only aware of TiddlyMap. Is that the tool you would suggest? Are there other options?
For my purposes, the simpler and stabler the better.
Let say I have a tiddler [[Apple]] and it links to Tree and Fruit and [[Red Things]]. I’d love to see visually, that it links to fruit, but that [[Fruit]] also links to [[Red Things]].
Yes as @DaveGifford points to Tidgraph is a good solution. There is a log of visualisations plugins available however sometimes it may be as simple as a list, the tree or table of contents macros, a list of buttons or next/previous etc… Using tabs can also help people see the related tiddlers in tabs.
Ask yourself if you want to review a map of all or selected relationships or do you want each tiddler to display where they are (eg breadcrumbs).
Others include;
When tiddlers are related by tags the presence of tag pills can help <<tag tagname>>
Smart uses of the list widget to build trees/list/tables.
Using icons set on tiddlers or to illustrate meaning
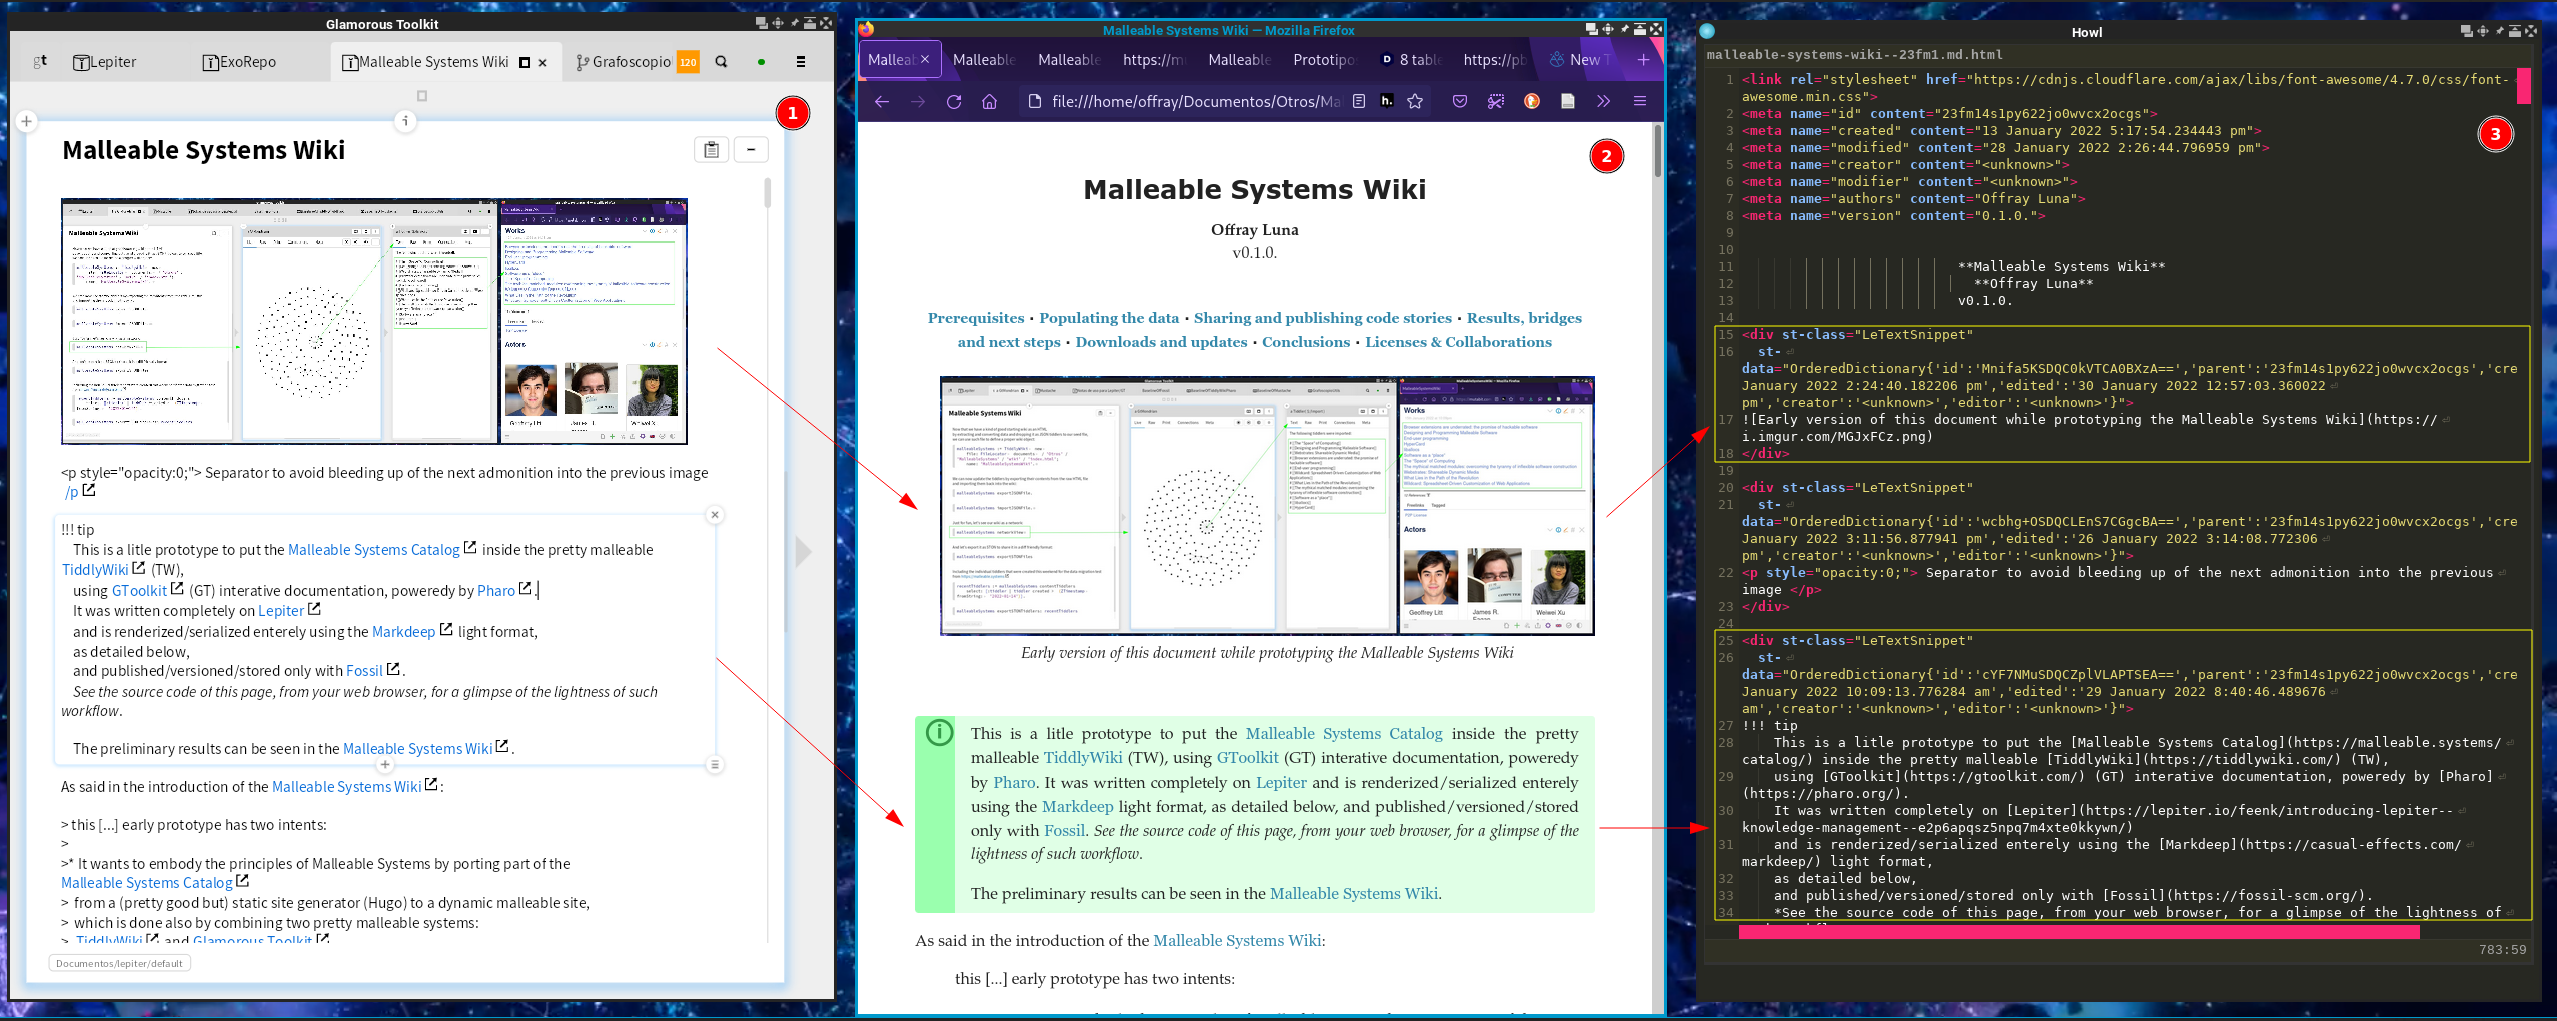
As you can see, the results are pretty similar to LogSeq and Roam. The caveat is that the parser for making such visualizations is pretty raw and in early stages and that the visualization lives outside TW. We are planing some Echarts export capabilities, but they will come as needed.