Introduction
For the last few months I’ve been working on a new TiddlyWiki plugin that provides interactive maps and other features needed by geospatial applications. The goal of the Geospatial Plugin is to enable non-developers to build sophisticated interactive applications that ingest, transform and display geospatial data.
The Geospatial Plugin is now almost ready for the first release but it would be useful to get some early feedback/suggestions/questions from the community before that point.
You can try out the preview build here.
The usual warning: preview builds are liable to further change, and should not be relied upon for important work. However, it is perfectly possible to download the preview build and work with it locally for experimental purposes. An empty build is available that includes the plugin here. Note that the Geospatial Plugin needs the associated custom version of the core, and will not work with the regular v5.3.2-prerelease.
The development of the Geospatial Plugin has been made possible through the generous sponsorship of @Hans_Wobbe via his company Datafix. If you or your company is interested in sponsoring my work, please contact me.
Links
- Geospatial Plugin Demo Preview Build
- GitHub PR for Geospatial Plugin
- Geospatial Plugin Empty Wiki Preview Build
- Updated Docs Wiki for Geospatial Plugin Core Changes
Overview
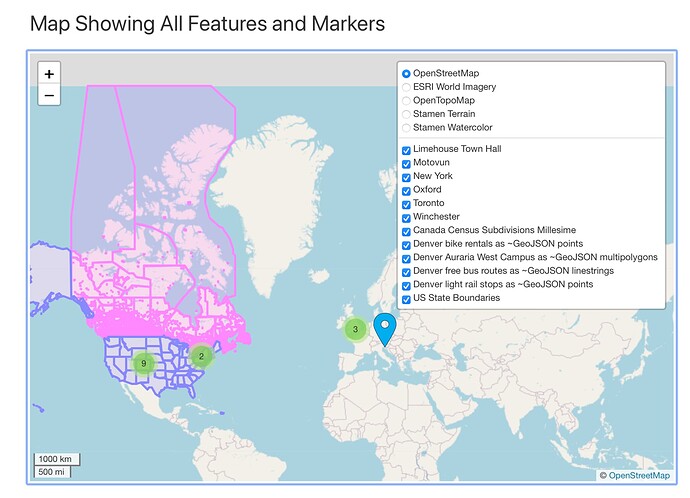
A number of features can be seen on the map within the greeting tiddler of the demo:
- Markers (the blue pin) and marker groups (the green circles) that represent multiple markers that are close to each other at the current zoom level
- Clicking on a marker displays a popup with associated information
- Clicking on a marker group zooms in to show the constituent markers
- Layers (the purple and blue areas) are essentially polygons defined by points with latitude and longitude. Again, clicking on a layer displays a popup with associated information
- Zoom and pan with a mouse or via touch gestures
- Layer menu at the top right that allows the base layer of the map to be selected from an extensible list including ordinary maps, satellite views, terrain, and attractive “watercolour” maps
- The layer menu also allows the individual map overlays to be hidden and shown
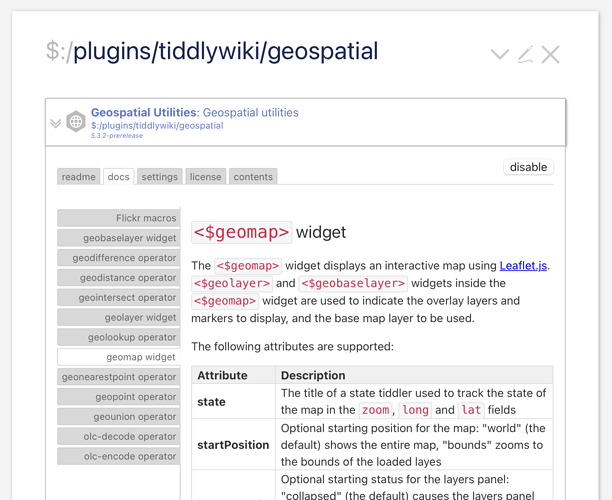
Scroll down further to see the plugin tiddler itself. The documentation is available under the “docs” tab:
How does it work?
Most of the functionality of the Geospatial Plugin is provided by third party libraries and online services:
- Leaflet.js, an open source library to display interactive maps
- Turf.js, an open source library to perform geospatial calculations with GeoJSON objects
- TravelTime, a commercial API for geocoding, routing and isochrones
- Flickr, a free API for retrieving geotagged photographs
- OpenLocationCode, Google’s open source library for converting to and from Open Location Codes (also known as PlusCodes)
The plugin itself is mostly the glue necessary to expose this functionality as TiddlyWiki primitives such as widgets and operators.
What does Geospatial mean?
Geospatial may be a new term. It refers to data that is directly linked to specific geographical locations. Thus geospatial data may be anything from a spreadsheet that includes columns with latitudes and longitudes to a complex JSON structure that encodes the boundaries of geographic areas like countries.
The Geospatial Plugin uses GeoJSON for the complex cases but also allows simpler representations, such as giving tiddlers latitude and longitude fields.
What is GeoJSON?
GeoJSON is a widely used industry standard representation for geospatial data. There is an enormous variety of publicly available data in GeoJSON format, and it is generally quite easy to find.
For example, Googling “geojson uk county boundaries” yields as the top match a good quality site that allows a variety of UK GeoJSON data to be downloaded, including the local authorities that define counties.
GeoJSON uses the following fundamental features:
- A point is a simple pair of latitude and longitude coordinates, with an optional altitude
- A linestring is a sequence of points that together define a path made up of straight line segments between the points
- A polygon is a sequence of paths that together define an area bounded by straight line segments that can have holes or discontinuous sections
GeoJSON features are often combined into “feature collections”, a single GeoJSON file
GeoJSON features can also contain an optional “properties” field containing user defined JSON data. For example, a GeoJSON file containing data about US states might be a feature collection of polygons, each with a “properties” field containing the name and population of the state.
The Geospatial Plugin offers many primitives for working with GeoJSON data. For example, the “geounion” operator takes any number of GeoJSON feature collections, and returns a new feature collection that is the union of them all combined.
Geospatial Plugin features
The main feature of the plugin is the <$geomap> widget. It uses the Leaflet.js library to draw a map with markers and layers overlaid over it. There is great flexibility as to loading and selecting background layers.
Other features include:
- Operator to compute the distance between two points
- Operator to lookup data within a GeoJSON object given a point
- Operator to find the nearest point to an anchor from a collection of points
- Operators to compute the difference, intersection and union of GeoJSON shapes
- Procedures to retrieve photos from Flickr (requires an API key to be set)
- Procedures to use Traveltime’s API to compute isochrones
The new <$testcase> widget
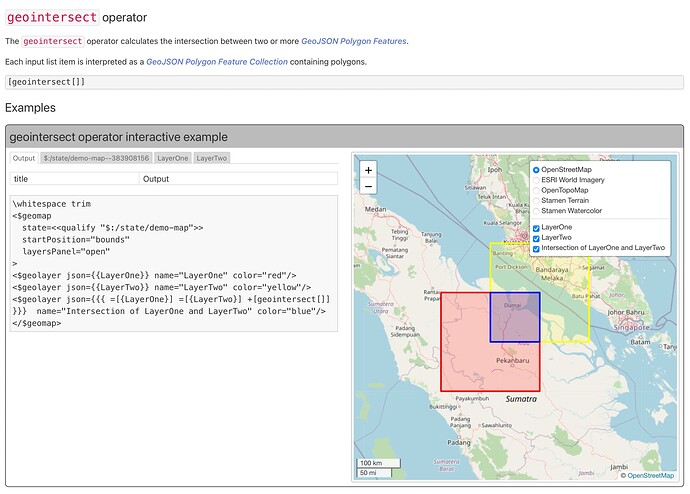
The Geospatial plugin includes full documentation, with many interactive examples that allow the source tiddlers to be inspected alongside the output that they generate:
The user can use the tabs on the left to see the tiddlers that comprise the example, with a live preview on the right. The tiddlers are actually editable so that you can modify the examples to see the effect. (Currently these changes are volatile and will vanish if the test case widget is refreshed. Nonetheless, being able to temporarily tweak examples is very helpful for simple experiments.
These interactive examples use a proposed new core widget that is currently called <$testcase>. It works like a lightweight version of the Innerwiki plugin by creating and displaying an embedded wiki. The difference is that the test case widget doesn’t generate an iframe like the Innerwiki plugin, but instead utilises a lightweight embedded wiki object that is rendered directly.
Some more work is needed on the test case widget before it can be merged to the core: for example, it would be useful to give it an optional iframe-based mode for examples that don’t work within the lightweight embedded wiki. The name might need tweaking too.
The documentation for the test case widget is available in the main preview wiki on Vercel.
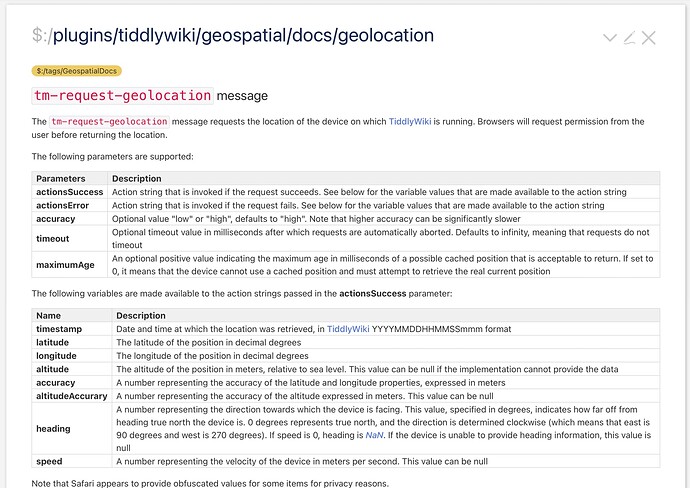
In a pleasing bit of recursion, the documentation uses the test case widget to show an example of how to use the test case widget:
Finishing Up
There’s a lot of information in this post, but hopefully the simple use cases for the Geospatial Plugin are easy enough. It is a work in progress and so your feedback, suggestions and questions are very helpful. I’d also love to hear about the kinds of applications you’d like to see for these new capabilities.


 )
)
