Hmmm, I had to do that several times before I asked the question; it seems to want me to wrap numeric values in Strings. So I thought I had done everything right there, and all my tiddlers seemed right. But I wanted to prove it to myself, and I regenerated everything from scratch, including a new randomized selection of addresses, and it worked fine!
I’m still not sure why. I am wondering if I was simply missing the (somewhat subtle) green circles that bundled additional locations, and it coincidentally, the number shown at my magnification happened to be ten with ten additional ones bundled. But I no longer have that version to check.
I’m curious what JSON you’re referring to. The data I’ve looked at on the demo page is all in individual tiddlers, not in a JSON bundle. In any case, my current attempt is modeled on “Map with Geomarker” inside $:/plugins/tiddlywiki/geospatial/docs/geomap, which uses individual tiddlers (cities/Oxford, cities/New York, etc.)
Ah, yes, I hadn’t spent any time with the shapes demos, thank you.
It certainly can be. I tend to generate such data programmatically, in good part for that very reason. It wasn’t an issue here, but thanks for the reminder!
Thanks @Scott_Sauyet. In fact, the getquerystring operator is no longer needed, so I’ve removed it. The alternative is to use the query-* parameters with the tm-http-request message.
Sylvain Comte’s Leaflet maps plugin is excellent, and has been deservedly popular since its debut in 2016/7. There are a lot of similarities with the geospatial plugin because it integrates the same mapping library and uses the same GeoJSON format for data. I think the notable differences are:
The scope of the geospatial plugin is wider, and includes geospatial calculations (eg difference, overlap of regions) from a library called Turf.js, and support for some geospatial APIs
The geospatial plugin takes advantage of some newer core facilities and techniques to be more tightly integrated with wikitext. For example, the Leaflet plugin uses a places attribute that contains a JSON definition of the tiddler data to be plotted. In the geospatial plugin a separate <$geolayer> widget is used for each item to be plotted. This means that there are fewer JSON strings needed to get things going
The geospatial plugin exposes some lower level features. For example, the Leaflet plugin requires editing a JSON tiddler to add support for a different background layer provider. In the geospatial plugin, the <$geobaselayer> widget can be used to directly add a background layer provider
In short, if you are already using the Leaflet plugin and are happy with its functionality there is no pressing need to upgrade. If the additional functionality of the geospatial plugin is of interest then I think the migration path would be straightforward, and only require changing a few templates and not your underlying data.
Looking at your example, is it just that clustering is enabled by default, so the markers that are close together are coalesced into a green circle that is quite hard to see in this context? I can see all twenty markers if I click on the green clusters to expand them.
I think that was probably it. I saw the circles in this demo. I didn’t keep the original demo where it seemed to be failing – but as far as I can tell, the only difference was a different random subset of my addresses. I may have just seen the round number of ten visible and make a bad guess.
I’m hoping to get back to this in a few days, but first I need to build the UI to allow someone to enter the data. Thanks for the reply!
I’m trying to use GPX files with the Geospatial Plugin, but I’m having issues. First, I tried entering the GPX data into a tiddler and changing the type to Application/JSON, but that causes a Javascript error when I try and map it. Next, I tried converting the GPX to GeoJSON, putting the GeoJSON into a tiddler and mapping it, but that didn’t work until I split the GeoJSON into separate files for lines and for points. The lines map and points map correctly (as in, their location), but the popups only show the last label in the file.
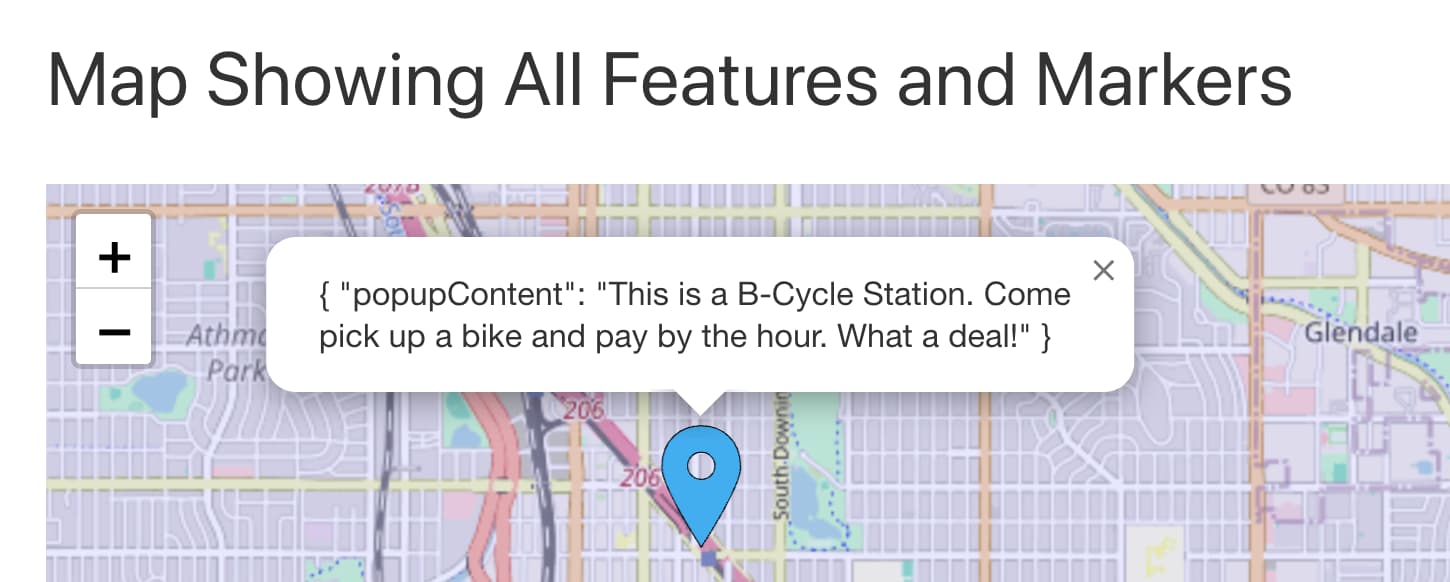
In addition, the popups are just displaying the unformatted GeoJSON content: “{ “popupContent”: “Florida Keys” }” rather than correctly as: “Florida Keys”. I’ve tried changing the “popupContent” property to everything I can think of (“name”, “ID”, “label”, etc) but it always displays the same way and it’s always the text from the last feature in the file.
Any thoughts on where I’m going wrong?
Here’s the GPX and 2 GeoJSON tiddlers that I have:
Hi @MrBatman777 I am very sorry that I missed your post.
The Geospatial plugin doesn’t support GPX, which is an XML based format.
I think that would be a limitation of Leaflet.js, all we’re doing here is handing it the block of GeoJSON.
The popup support is unfinished. I would really like to be able to include rendered wikitext within the popups but if that is not feasible it most be possible to support providing a user defined function that converts a blob of JSON properties to a text string.
I went back to using the Leaflet plugin and it’s working fine. It doesn’t have some of the features that (I think) the Geospatial plugin has, namely the ability to calculate the length of a multi-segment line, but I added that myself. I’m not sure that the popup only displaying the last label in the file is a problem with Leaflet.js because it works fine in the Leaflet plugin and isn’t that based on Leaflet.js as well? I’m sure I’ll try the Geospatial plugin again at some point, but for right now Leaflet works well enough for my purposes. Thanks again for getting back with me!
Happy New Year fellow GeoJSONers here.
This plugin and development fork of TW is awe-inspiringly powerful, I believe. And I want to be a part of this. I myself am a map maker.
At the moment, I’m working on a Buddhist pilgrimage map of the 88 temples here in Shikoku. A TiddlyWiki would be a perfect match for this project.
But… I find the learning curve to this plugin quite steep, to put it mildly. I’ve been coming here for months and months and haven’t even been able to create a single Tiddler with even a simple waypoint marking.
Could I suggest a “Getting Started With Your First GeoJSON Map” or something to that effect?
If you are interested, I use QGIS, its Leaflet plugin, data from WOF (Who’s On Frist), OSM (OpenStreetMap), etc.
If you will allow me to say so: the sky is the limit with TW and this plugin!
Very warm wishes to all of you going forward into the New Year!
Your project is lovely idea
And application if TW
Yes please
TW is great
But the learning curve is killer difficult confusing for most “authors” editors or presenters of book or lecture presentation material, especially those which lean into graphics, illustrations, and interactive linking of time place context source and sequence
TW seems like the ideal tool framework to assemble edit select sort caption = structure a collection or them
But the learning curve can be terrible from an author editor point of view.
I hope this year that your project comes to light.
And mine too !
Jason,
I wanted to say thank you for the kind words of encouragement on my project. It meant a lot to me to read that. And I would be interested in knowing what kind of projects you might be doing.
Here is an update on the 88-Temple Pilgrimage.
I’ll be taking the Geospatial TiddlyWiki for a test drive today. Only, I’m not driving, I’m taking the train and the Ankle Express on my way to my second Karate lesson I started last week.
Our teacher will be giving me my new uniform. So, I need to remember to pay him. That means I have to go to the ATM before they close. (Can you believe ATMs have opening hours here). And the lesson fees. I don’t want to be humiliated front of the other students.
So, about the practical uses of TW.
I had to fiddle with the Wiki for some time before I was able to get the markers to show up on the map. Even AI seemed to be of little help. When I finally did, it felt like a new world had opened up for my with regards to the mapping work. I was able to mark out all the areas I needed to get to and placed them into my TW.
Included links for walking times from OpenStreetMap.org from the station to the Dojo. Train schedules, etc. As well as the trip to the bank.
Later, I’ll be doing this for the 88-Temple maps. I’m hoping the maps will give trekkers more value to the things that are right in front of them.
The result of having everything in one place on a Wiki: spend LESS time looking down at the phone. More time looking up and taking in what’s important.
I may have been rambling on too long, sorry.
I hope you’re finding more success with your Wiki work.
@jeremyruston I have come across your geospatial plugin as a proposed project is interested in a map interface to its contents. I notice the doc specifies ‘experimental’ and version 5.3.6. What is the status now?
The stability badge “experimental” means that the plugin is in early development, and internal interfaces may be subject to changes that are not backwards compatible.
There are currently 5 plugins marked experimental: the Geospatial plugin, Confetti, Stacked View, Tour and tw5.com-docs.
I think that now we can consider all of these plugins to be stable, and so I’ve made an update for the next release here:

 and everywhere