Doc site: 高维表格 — 美观高效地展示大量数据,为你的条目生成数据透视表等高级表格展示方式。
Github: https://github.com/tiddly-gittly/hyper-table
CPL: Plugin_202405082237098
Doc site is bilingual, you can switch to en-GB. Thanks to feat: t macro and docs by linonetwo · Pull Request #7821 · Jermolene/TiddlyWiki5 · GitHub
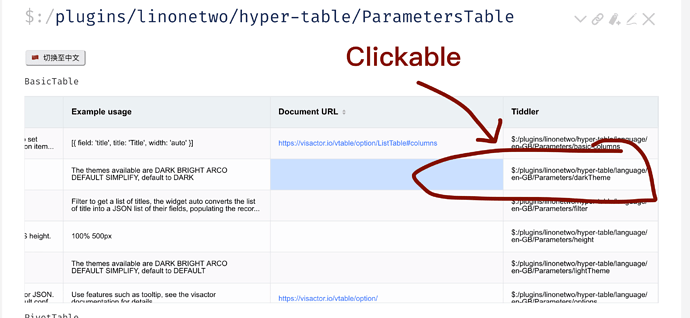
Basic table
It is very fast, rendered using JS canvas API. And adapt to mobile, shows scrollbar when width is not enough (this is what I want, and why I create this plugin today).
You can also drag to change column width, click on title to sort if you config it properly.
You will need to read the options manual to config it https://visactor.io/vtable/option/ListTable
Or copy the examples on my doc site. I will also provide some prefab so you can use them directly.
This is very simillar to the usage of ECharts - Bringing amazing visualization tools to TiddlyWiki!, they are both a thin wrapper around a JS library, and accept that library’s options as widget parameter. So it’s powerful but maybe hard to get in hand.
Prepare data with filter
This is from $:/plugins/linonetwo/hyper-table/ParametersTable tiddler of doc site.
<$basic-table
  filter="[all[shadows]prefix[$:/plugins/linonetwo/hyper-table/language/zh-Hans/Parameters/]tag[BasicTable]]"
  columns=<<columns>>
  options="{ defaultRowHeight: 60 }"
/>
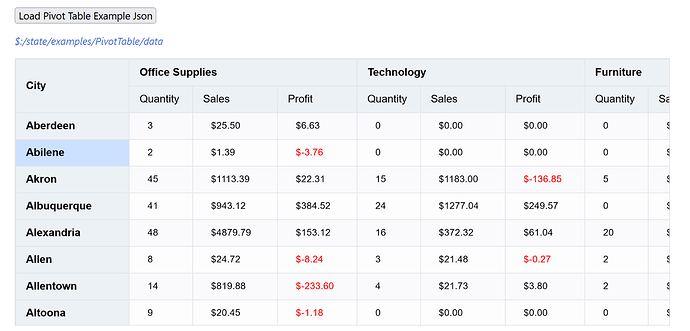
Pivot table
This is too advanced, that I don’t even know how to config and use it… But time will tell it is useful!


