I can’t figure out a particularly clean way to do this, and am looking for suggestions. Am I right that TW doesn’t want to generate partial elements, such as a </tr> and then a <tr>? I’m pretty sure I’ve run into that restriction before. If that was possible, then I could simply check if the list index was equal to 3 (mod 4), and insert the close and open row tags in that case. But I don’t think this will work. And this naive attempt fails (perhaps for some unrelated reason):
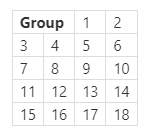
Is there some reasonable way to do this? It does not have to be very generic, as I want to do this twice, once with a 3 x 3 table and once with 5 x 4 one, each with a 2 x 1 introductory header. But in each case, I would rather do this inside a loop with <$list> than to copy the 7 elements in the first table and 18 in the second one. (Still, generic wouldn’t be bad. Take a list, row and column count, and width of the header and a macro to convert the elements, and get back the table. But that’s not the main goal.)
Does it need to be a table? Since your “header” is flowing directly into the first row of results, I’d be tempted to use a CSS grid display instead. You can set your desired number of columns with grid-template-columns, style the header cell grid-column: 1 / 3, and then let your list fill in the rest of the cells as single-column divs.
That will probably work. I had a few bad experiences with CSS grids many years ago and forget to consider it these days. But it’s probably time to try it again. So long as I can set gutter widths to 0, I think it should do. Thanks for the advice!
Thanks for this! I think this is probably the right tool for some challenges I’ve had… where I had been trying to use multi-column tiddlers, and finding it difficult to specify columnbreaks or anything like widow/orphan control. Time to see whether grids are the solution!
I believe there is a code pattern to this class of problem and I will give it some thought, however there are a range of CSS solutions including flex grid and others designed for this very purpose.
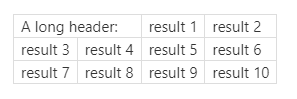
The only thing is I would question the desired output, is it really a layout people would like? For example this is similar and much simpler;
A long header, result 1, result 2,
result 3, result 4, result 5, result 6
result 7, result 8, result 9, result 10
Also the length and padding operators may assist with aligning into columns.
Thank you. This is very interesting. But it’s solving a somewhat different problem than I have. My tables are small enough that I could easily code them in HTML/wikitext. But the cells are almost identical, except for a variable that I use twice in the output. It’s that duplication in the source code I want to avoid, especially as I imagine this will likely not be the final version; it’s sure to be changing sometime soon. But I can see many uses for your approach.
If you come up with something, please do share. I will try the CSS-grid approach instead and I expect it will cover all my needs. But I’d really like to know if this is possible, as I’ve wanted things like this before.
That’s pretty much what I have now. This is an attempt to improve on it. First of all, the word “result” was just to demonstrate transformation of my values, which in fact are just the integers 1 - 7 in one case and 1 - 18 in another. The transformation is to turn them into hoverable sections, to make the following somewhat nicer:
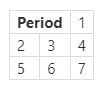
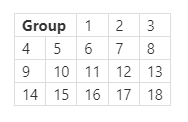
One table has 7 values, which really are just the numbers 1 - 7, with hoverable behavior associated.) The other has 18 of them with slightly different, but very similar, behavior. Again, the UI is just the numbers 1 - 18. Each set has has a one-word header. The two big design constraints are first, that this has to fit in a very limited space, and second, that I want there to be no space between them. (Hovering each one dims most of the accompanying UI, and having the whole thing undim as you move focus between them is distracting.)
Would fix the design problems with the current list-based approach.
That’s what the question was for. I did not have any coding time last night, but should tonight, and will try the css-grid technique. I imagine it will work. I’m all ears for alternative suggestions.
Something is slowly forming out of the fog in my mind. At a high level some thoughts follow, tell me if this is a helpful approach or not?, it’s like a “mind meld”. I am straying from the simple case you raised here back to the periodical table.
Now imagine we have one or more “data tiddlers”, with the X,Y coordinate as the key, rather than display the co-ordinates, use them to lookup in each of these data tiddlers, to get a value, such as the element name (if any), other content like header etc… the style to apply to the cell etc…
This is practical if the total table size is not going to change, that is when the X,Y co-coordinates are fixed.
using the number of rows/column and row/column number, for each cell we could calculate a 1 to Nth key rather than co-ordinate key, if necessary, allowing the table to change rows/heights later, however this would be unhelpful to the periodic table (because there is a special organisation applied), it may help in your minimal test case.
Now while this may look like it would take time to fill out the data tiddlers you could generate a copy of the table that allows you drag and drop “elements” on cells to assign the element to a particular cell (in the data tiddler). Similarly to drop text and even styles.
I am, still to workout if our cells styles can include cols etc… that would merge cells, however overflow may also work.
Perhaps we could then add drag so even once dropped on the table they can be moved to another cell.
This could be taken further with drop handling for empty vs full cells etc…
Additional dimensions;
Each additional data tiddler with keys based on our tables is effectively an additional dimension thus another could be created to lookup the group in which the cell is part of, although I think in this case it is best stored in each element.
These additional dimension data tiddlers can be generated programmatically to save design time.
You can always add another dimension and these remain somewhat independent of the data and presentation (table), effectivly index tiddlers.
As I think about this further, developing such an addressable table could be a solution to a range of layout issues, it may prove to be a useful general solution. Especially if the data tiddlers have a simple integer key because then the data can be applied to variable row column tables, and different “array” manipulations can occur.
The Groups of elements can be represented as an attribute on every member of that group (or lookup table), then it looks as if behaves as a group. Eg alt-click one in any group and it opens in a group view.
Primary and Secondary tables could use integer key(s) as well.
This alternative is not terribly far from how I did the main table. The big difference is that instead of encoding the (x, y) coordinates inside the elements, I have a separate tiddler that houses that information.
The idea of this thread really is about a smaller problem. I did get it working with CSS-grids, and the latest version shows this in the period and group annotations in the bottom corners of the table.