Question: How to create a loop to generate html elements?

Hello everyone,

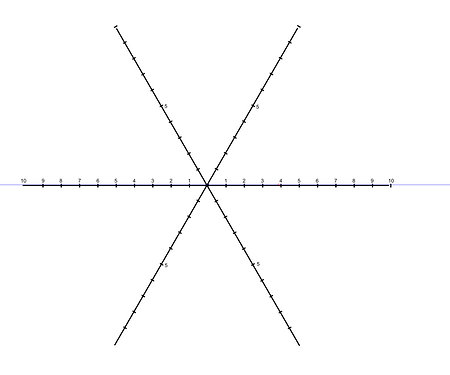
I’m trying to set up some kind of loop to generate an SVG image dynamically, the goal is to generate a spider graph dynamically.

I thought about using a list widget with a counter to serve as a while() loop but the list widget iterate over a list, and I don’t know how to generate a list of n item from a variable.

Then I tried to use recursive transclusion but didn’t succeed: I think I need to trigger a macro to update a field value on each pass but don’t know how (and it’s probably really bad for performances anyway).

Is there a way to iterate a code an n number of times? If not, can you give me some hints on how I can use regular javascript and wikitext to achieve this result?

Thanks!

1 Like

Hi @telumire You can certainly call a macro on each hit in a recursive list. I do this general kind of thing all the time; here’s an example.

If you just want to repeat some code n times, you may find the range filter operator interesting.

Best,
Chris

1 Like

Thanks a lot, this is a great example !

1 Like

@telumire another method can be storing a list (even the result of a range operator - but typically a list of titles) then using setWidgets index parameter to address each item inside the variable (0- based index)

With 5.2.0 the list widget now has a counter=variablename parameter that returns a 1 based counter for each list item. With this you can have the opportunity to treat the first or Nth item differently and if previously you used count to establish the number or elements you can also determine what the last element is.

In short the use of the new counter variable, the range operator and or the set widget index opens the world of tiddlywiki looping much further.

So we can all be much more “loopy”!

1 Like

@TW_Tones: this new looping index with list is great. I had develop it for my own usage. I’ll be glad to switch to the official version when it’s available. Do you plan to include a possibility of choosing the starting index and the increment?

Normally I would use 1 to n. You could have a

Inner list (but one) that tests your counter is in a range or greater than.

The default 1…n is the one to use 99.9% of the case. But it’s so easy to add value for start and increment that it really can be worth doing it.

But I won’t complain if TPTB (tghe power that be) says only 1…n.

1 Like

@jypre if for example you wanted to convert “item” to the zero based index just subtract 1.

<$list filter="[tag[TableOfContents]]" counter=item>
   <$text text={{{ [<item>subtract[1]pad[3]] }}}/> <$link/><br>
</$list>

Of course I could offer more examples using the item as an index into a variable in a set statement. Or driving the counter with the range operator then using the index but there are so many possibilities I will leave it for you to ask or do it yourself.

@TW_Tones , if you go to create a list, it is better use the HTML elements for list, in this case the ordered list ol

Here your example with ol

<ol start="0">
<$list filter="[tag[TableOfContents]]">
   <li><$link/></li>
</$list>
</ol>

@Alvaro ol is fine if you just want the items numbered, or to remain up to date if using draggable lists however the number is generated by CSS and not available to your code. There are range of other “algorithm’s” that need the “index” or counter, such as detecting the first or last, making calculations and inserting content generated in wiki text. In many cases a CSS equivalent appears including the nth item, inserting content etc… but this is more the “display layer” and not the “application” layer.

In my case, I needed it to inser some data from a parallel list. It was the only possibility (I tried a lot of other ways!). For this kind of needs, having the default index is just enough, as, as @TW_Tones showed, you can always make simple computations to alter it to your very need. But, true enough, choosing the first digit would be cool (0 or 1 most of the time) and could avoid any calculus.

2 Likes

The following code demonstrates driving a list by a number.

It also demonstrates how to use the set select to access the members of a list via a number.

I believe it could help in the Original post but it also demonstrates my suggestions later in the threads. Study this closely and I think you will find a solution for most related cases.

Works on tiddlywiki.com

<$set name=my-list filter="[tag[TableOfContents]]">
<$set name=total filter={{{ [enlist<my-list>count[]] }}}>
<$set name=start value="3">
<$set name=end filter="[<total>subtract[3]]">

<<my-list>>
:Total <<total>>
:Start <<start>>
:End <<end>>
<hr>
<$list filter="[range<start>,<end>]" variable=index counter=list-item>
   <$set name=zero-index filter="[<index>subtract[1]]">
   <$set name=detail filter="[enlist<my-list>]" select=<<zero-index>> >
     <<list-item>>. <$link to=<<detail>>/> (<<index>>,<<zero-index>>)<br>
   </$set></$set>
</$list>

The format of the range operator and the counter variable requires 5.2.0+

3 Likes

I dont know how I missed this, up until now I used nth[n] to get the nth output of a filter… this works great ! Thank you all for helping me understand tiddlywiki better!

By the way, here’s the spider graph : TW-tips — useful information collected from the tiddlywiki community, I think I will do a cleaner redo with all the knowledge I’ve gained since thanks to you :slight_smile:

2 Likes

That looks great!

I have always wondered with these “spider” graphs if the area inside should be compared with the area outside to determine the magnitude when compared with other sets of values.

Perhaps 6x100=600 the, divided by the sum below. Not so much the graph area as projected in 2D but the sum in the 6 Dimensions we are measuring?

defense : 90
offense : 70
passing : 100
power : 70
reliability : 100
shooting : 70

@telumire … I do like it, but I think the “coordinate grid” is a bit to dominant. I’m thinking about a grid more like this.

This is neat!

Somewhere on my list of things to do is radar graphs for my tasting notes edition. I had been thinking I might find a way to use chart.js without directly including it in the wiki to create the graph and then render and save as an image. A wikitext based solution opens a lot of possibilities!

2 Likes

@telumire
Absolutely amazing! and also your moremath.js!

keep going on!

1 Like