
#newhere forgive my ignorance.
I’m investigating the possibility of using dynamic svg as a visual navigation tool for my upcoming tiddlywiki projects.
Has any work been done integrating observablehq.com visualisations?
I am imagining meta-tag sets and pearltrees.com like dynamic node nets.
1 Like
pmario
April 25, 2022, 1:37pm
2
1 Like
Ste_W
April 25, 2022, 6:16pm
3
Pearltrees and tiddlywiki?! Yes please!
I think tidgraph is an svg generated from tiddlywiki data, but I could be wrong.
http://ihm4u.github.io/tw5plugs/
A few years ago I made most of a plugin to integrate Snap.SVG into tiddlywiki (the example wiki is here Snap.svg Work — a non-linear personal web notebook ) but I never really polished it.
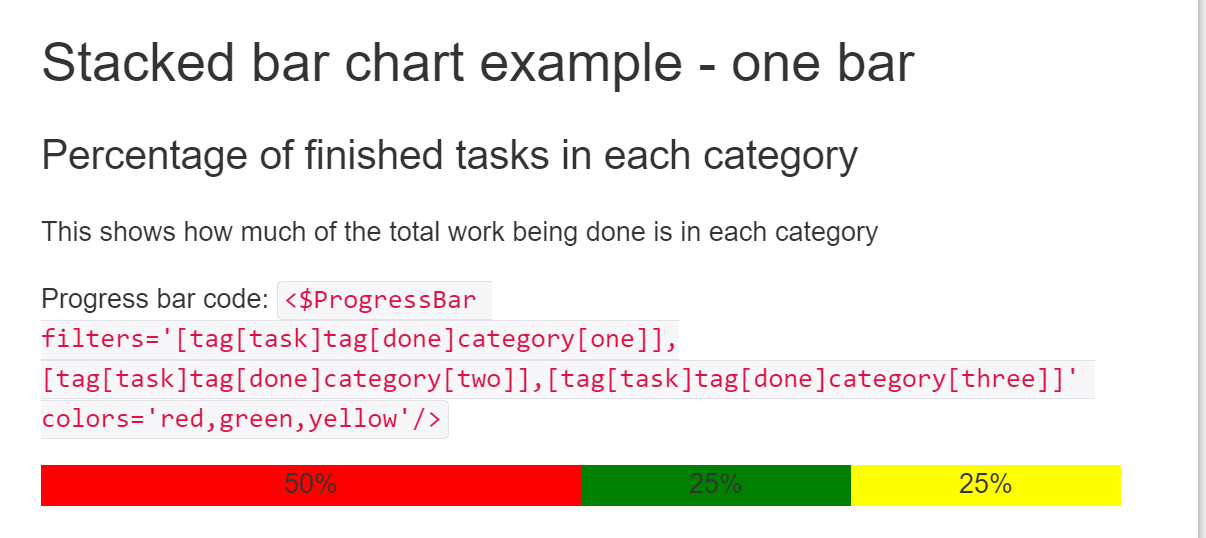
I also made some simple svg bar charts (BarChart Demo Edition — a demo of the plugin )
and scatter plots (ScatterPlot Demo Edition — a demo of the plugin )
they aren’t anywhere near as complex as the examples you lined to, but they do show that at least simple versions of the sort of plotting and interaction is possible.
1 Like
It is simple and to the point.
I used and use it a lot…
TT