TW’s built-in performance instrumentation is unfriendly to non-developers. You need to know how to use developer tools in your browser and it gives a bare minimum of data. Wouldn’t it be great if you could do it all in the UI, see more context for the data and be able to sort it?
An override of TW’s built-in Performance class to make it collect a lot more data
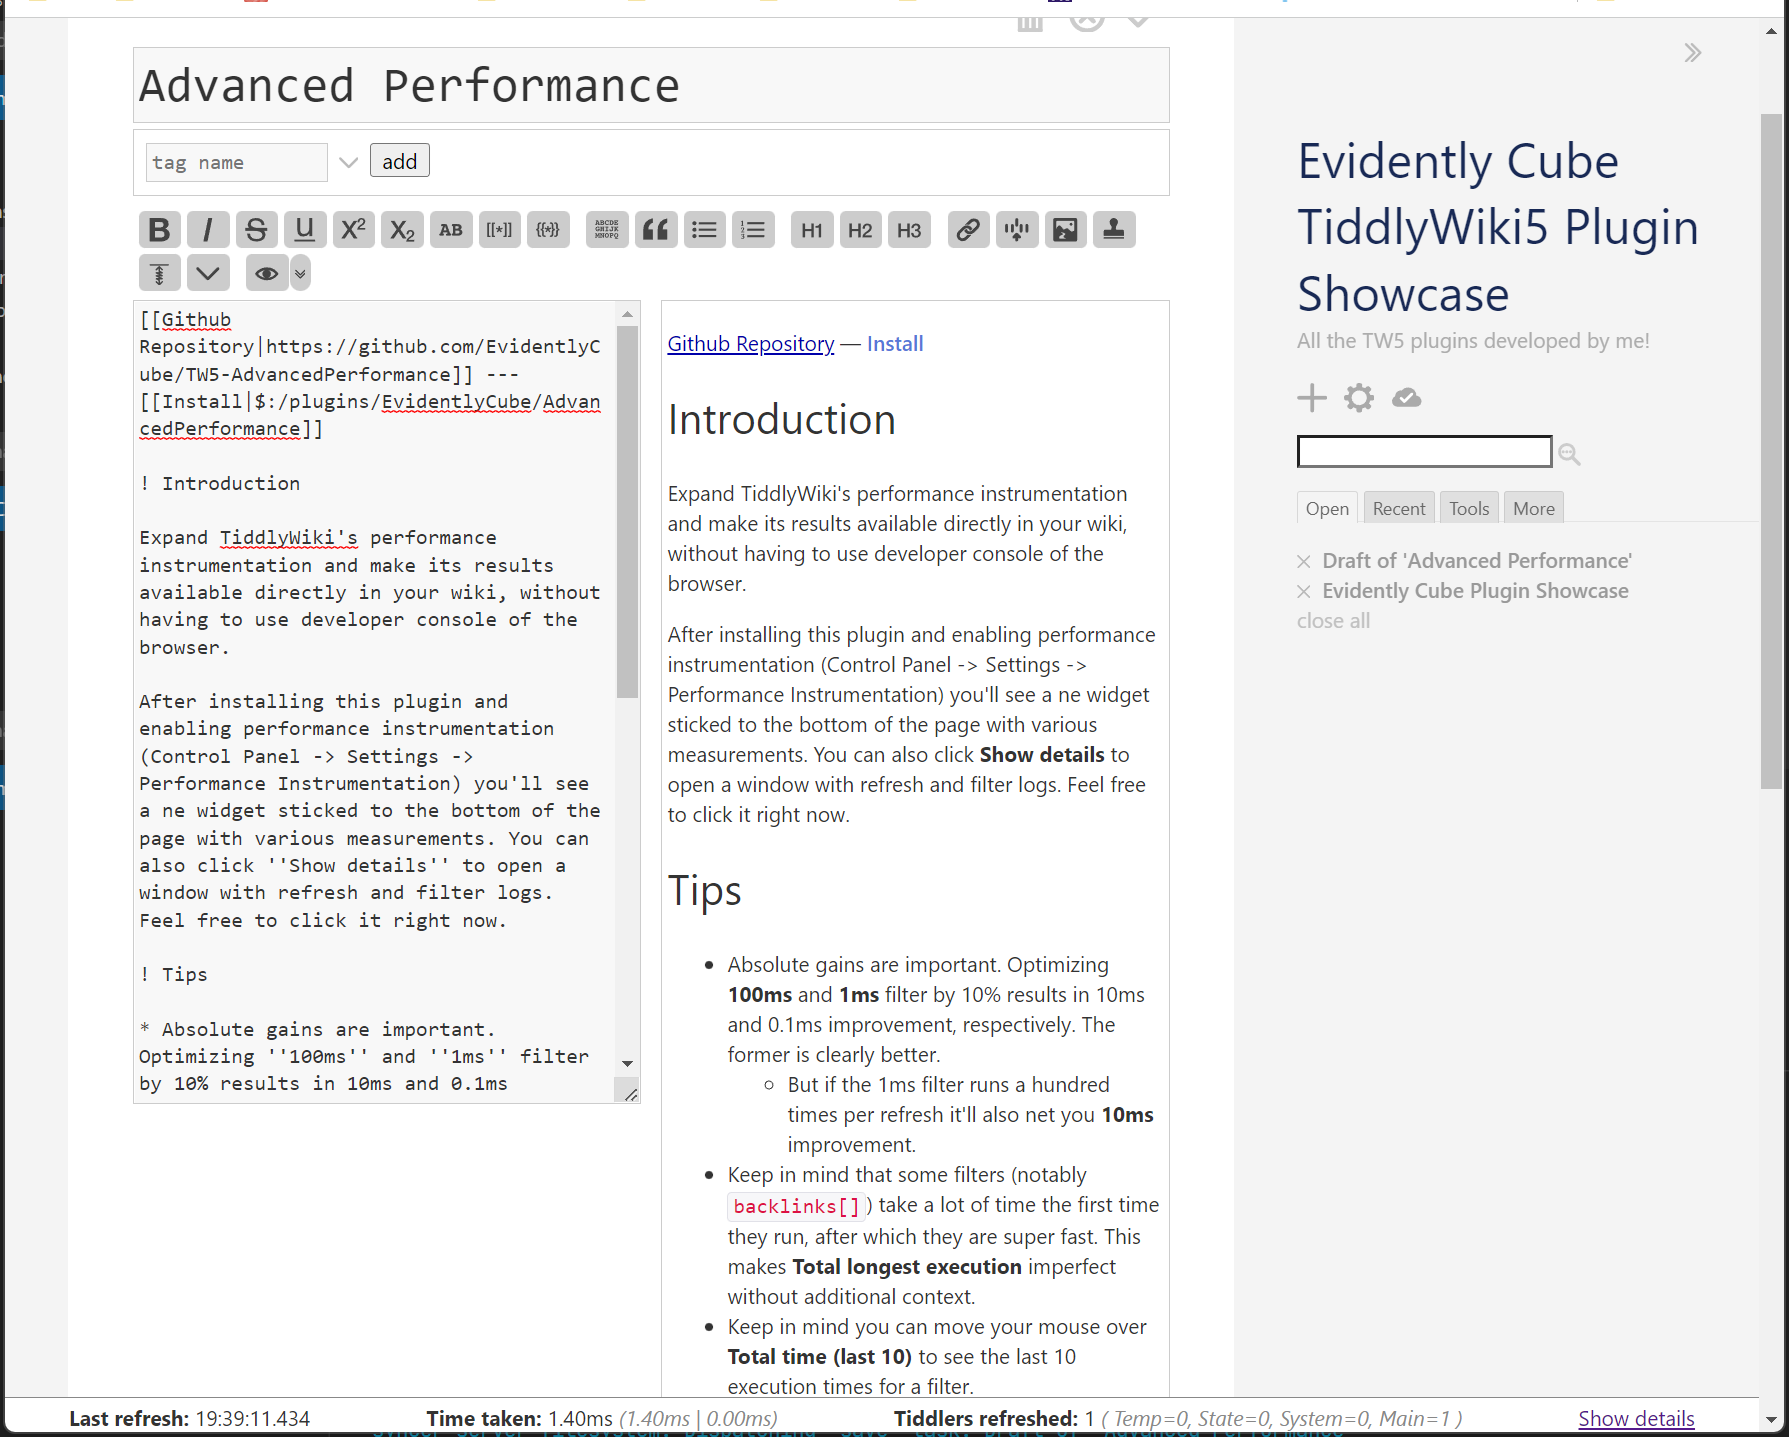
A small widget fixed to the bottom of the screen showing you details of the last refresh
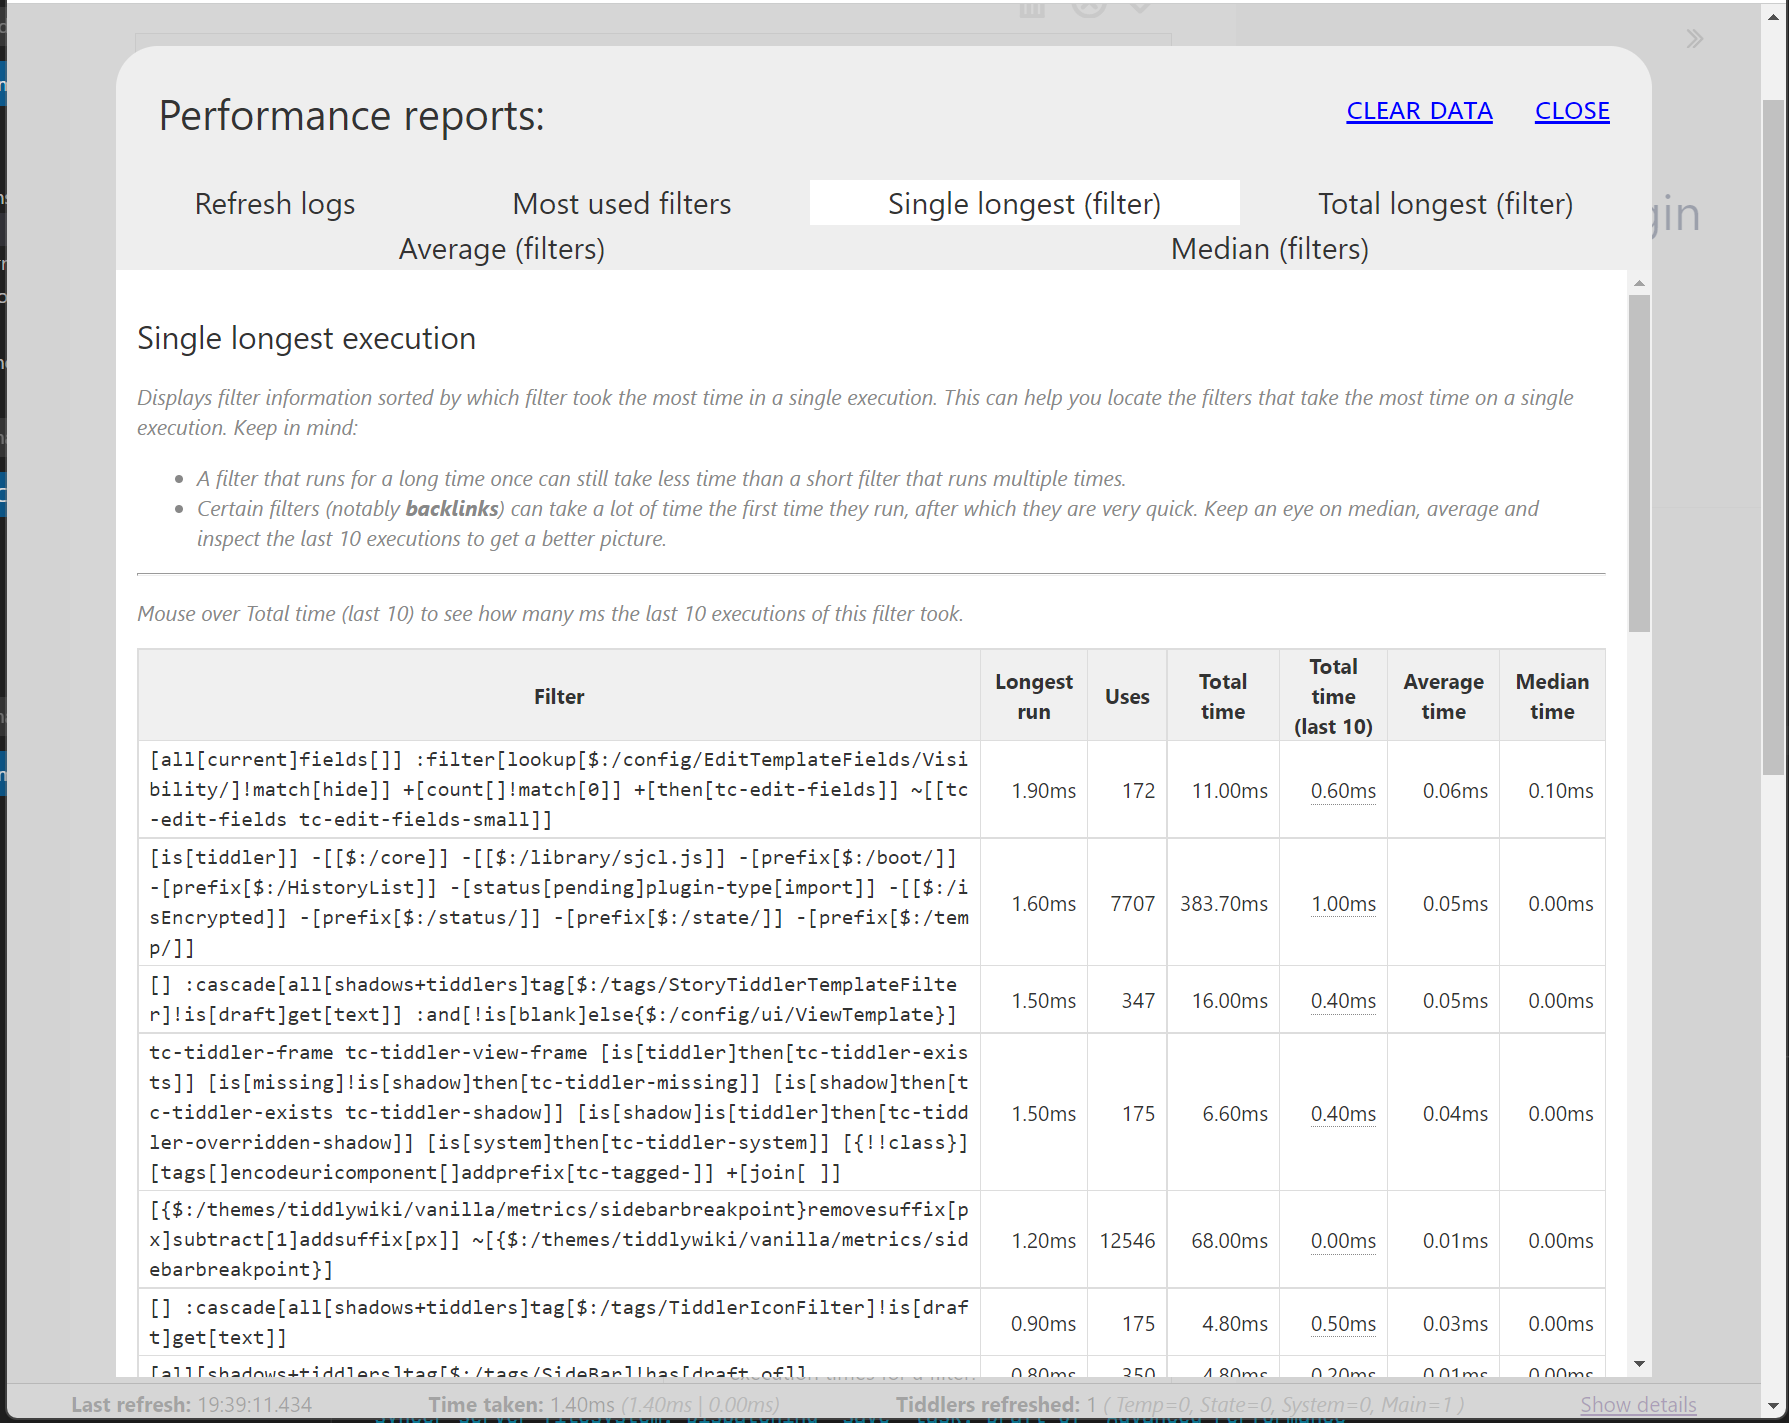
A full-screen panel where you can inspect various logs or clear them
There is no sorting per se – the 5 panels just display the data sorted in a different way.
I tried to make it a bit more friendly to people who’re not developers but also to just surface more information and context that should be helpful in discovering the best candidates for optimization. I don’t have any heavy wiki to test it with, though, so I don’t know how useful it truly is.
It should be safe to use but, just in case, it might be a good idea to backup your wiki first.
It started by me wanting to just slightly expand TW’s core Performance class but I soon realized that I have a few problems:
It’d have to be a big change
It’s a memory hog
The UI has to be written without using TW’s microkernel in any way, because then any interaction with the UI would cause the UI to have new data to work with, something I wanted to avoid. Right now the panel just covers everything and unless you have some weird mouse listeners or timers set up, you should be looking at a snapshot in time until you close the panel.
Update history:
1.1.0 — this big update adds two main changes:
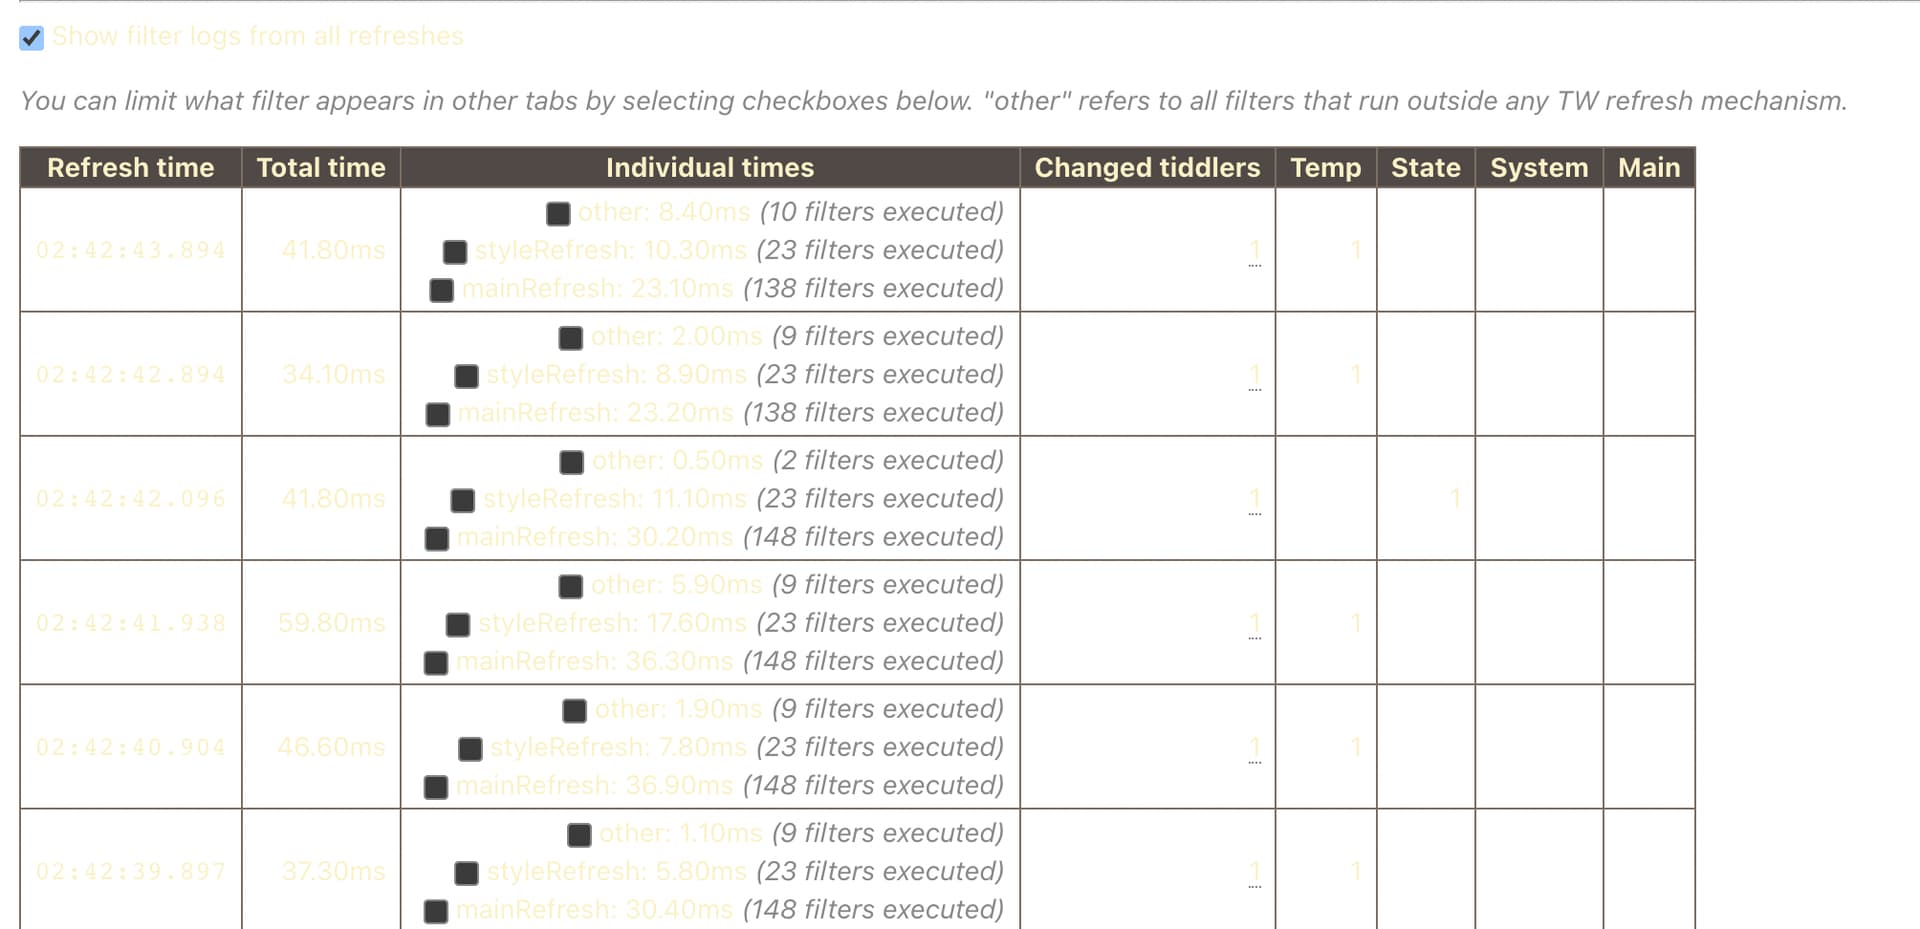
You can now select refreshes and only display filters that executed during them
Filters that run outside the established refresh mechanism are now listed under other refresh and can too be filtered
VERY impressive. I could easily spend a lot of time experimenting with various key algorithms to see which is best suited for my purposes.
As an alternative, I am likely to try to find a simple single subset metric that can indicate hotSpots and capture that data. That way, a bit of a trend analysis may give more insight into the benefits of optimizing bits of code.
Nice work! I can see where this is going to be incredibly useful. I’ve already discovered a few things about my TW that I didn’t realize.
One observation that probably only affects Windows users. When i first installed it, I didn’t see the widget at the very bottom and was wondering what was wrong. It turns out that if the browser window is maximized vertically, then the widget is covered up by the task bar. I have my task bar on all the time so I suppose if it were set to auto-hide, this wouldn’t be an issue.
One question: would it be hard to have the show details window show up as a separate window that could be displayed all of the time? That might result in a performance hit, though so probably not a good idea. I ask the question because I’m using the menubar plugin and would like to see how much of a performance hit my menus take, but they disappear when I show details so not sure if I’m actually measuring the performance of the menu itself or not.
You mean the windows’ task bar? That’s weird, because I also have it set to always on. The footer widget occupies the same space as draft notifications do (the red ones you see if you have an unfinished draft that’s not open), so if you can see those you should be able to see the widget.
I think a floating window might be a bit too much work, but I was thinking about something else:
In the first tab allow selecting one/multiple refreshes and cause the remaining tabs to only display filter timings from the selected refresh(es). I think that would allow you to time only those menus, am I correct?
Yes, I meant the windows task bar, but now it doesn’t seem to be covered up any longer. Not sure what the difference is. Oh well. Maybe it’s something peculiar to my setup.
I like your idea about being able to select refreshes. Seems like a better idea than mine for sure.
Very nice plugin!
I don’t have any covering issues, either.
Could it be useful to display the list of refreshed tiddlers in a tooltip when hovering over the Temp, State, System or Main numbers?
Actually I think what happened, as it’s something that happens sometimes to me - for some reason an app will be in this weird state where it’s supposedly maximized but it’s maximized as if the task bar was turned off. I never figured out when and how it happens but I’d just call it a random bug in Windows.
New version with this feature is up!
I’ve also did a silent change with how click events are handled and it’s possible that now the menus will no longer close when you click to open the details modal, no promises though as I haven’t checked it against anything.
Dead right :-)! The whole browser inspector thing for that kinda thing just confuses me.
Your tool I can use and make some sense of.
I have used it now on three wikis I’m currently developing and on one of them it did quickly show me I was using Tags far too much and in a too complex way. So thanks!
If there were one thing I would like, though I can probably do it for myself, it that somewhere we have a toggle button that will, on one click: (i) switch off/on the Performance Instrumentation setting & (ii) disable/enable your Advanced Performance Testing plugin.
Just a thought!
This looks like an excellent plugin: thanks so much for making it!
One potential issue is that it’s very hard to see using my preferred Gruvbox Dark palette (and perhaps any dark palette) – please see the screenshot below for the issue, although it can be fixed by editing the stylesheet to include a ‘color:black;’ property (e.g., for the ec_ap-footer id).
A similar thing has occurred with a few other plugins I’ve used (e.g., TiddlyMap) with my preferred colour scheme, and I think it might be just a TiddlyWiki dark palette setting (and personal stubbornness!) issue.
IF (and only if!) it’s not too much trouble, it would be great to know how you go about updating plugins to cope with all custom plugins – I’m just wondering if there are some simple CSS properties (e.g., currentColor or similar) to help ensure stuff works no matter what palette someone has picked.
It boils down to replacing some of the colors with calls to colour macro, as documented here.
The changes that added the support for palettes were done in a single commit which you can inspect here. For example:
The modal’s partially-transparent background was previously part of the main wrapping div #ec_ap-wrap, but because I can’t easily modify the transparency of a color via a macro, I extracted it into its own div #ec_ap-cover taking the color from modal-background and giving it opacity.
.ec_ap-muted which is used for less relevant or description text now takes color from muted-foreground
I changed some buttons to use a tags and gave them tc-tiddlylink class so they are now styled the same way a TW link is.
That’s really helpful – I think this information will allow me to amend a few other plugins I use which don’t always play nicely with the Gruvbox Dark palette, and I’ll aim to use your method to adapt anything I release for different palettes, too.
Version 1.1.2 was released: it fixes a rather funny bug, where in some cases if stars aligned correctly, displaying results from a refresh would be delayed by a refresh. Basically the last results you’d see would be the ones from refresh before it. This depended on the order of startup scripts executing which could be affects by having plugins installed with various dependencies.
The new version can be downloaded from here and now there is also a plugin library that you can install if you prefer it that way.
Version 1.1.3 was released which addresses the issue reported on Github. Subfilter executions are now stored separately with proper annotation. Their duration is still included in the main filter’s run as I believe it makes most sense, but there should no longer be any confusion about what numbers mean what.
Hi @Maurycy, great job!
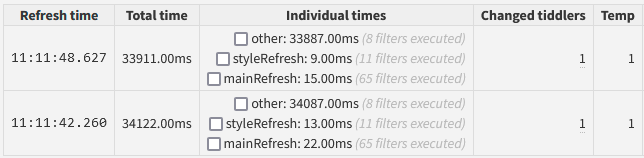
I did find another thing when trying to understand the “other” refresh times…
These are the results from a test where I actually just wanted to check your subfilter update:
and then clicked the button as as soon as a previous run was done. If you change the subfilter call inside the actions macro from subfilter5 to subfilter1, the reported “other” numbers get smaller, but are still larger than the real time that has passed during refresh.
@Yaisog Ah-ha! That sounds familiar. I have a branch that I hadn’t touched in a while which adds even more analytics where I fixed this issue. I’ll see about transplanting that fix and releasing 1.1.4
@Yaisog Thanks, that was actually unrelated to what I had in mind. I completely missed the fact that the duration for other refresh is calculated from the filters duration itself, which caused subfilters to be double (or triple or more) counted.
Version 1.1.4 is out with the following changes:
other refresh now correctly ignores subfilters when calculating its duration
Tabs ‘‘Median’’ and ‘‘Average’’ now display subfilters just like other tabs do
I also included your example in the plugin’s test cases – I’d like to add a small “(Thanks to XYZ for providing this example)” with a link, if you’d be kind enough to tell me what name to use and what to link to.