I use headers tagged $:/tags/ViewTemplate which make liberal use of $list filters.
These headers now result in steadily increasing delay as more tiddlers using them are opened in 5.4.0. Some degree of delay has always occurred in this case, but the cumulative effect is much more prominent now.
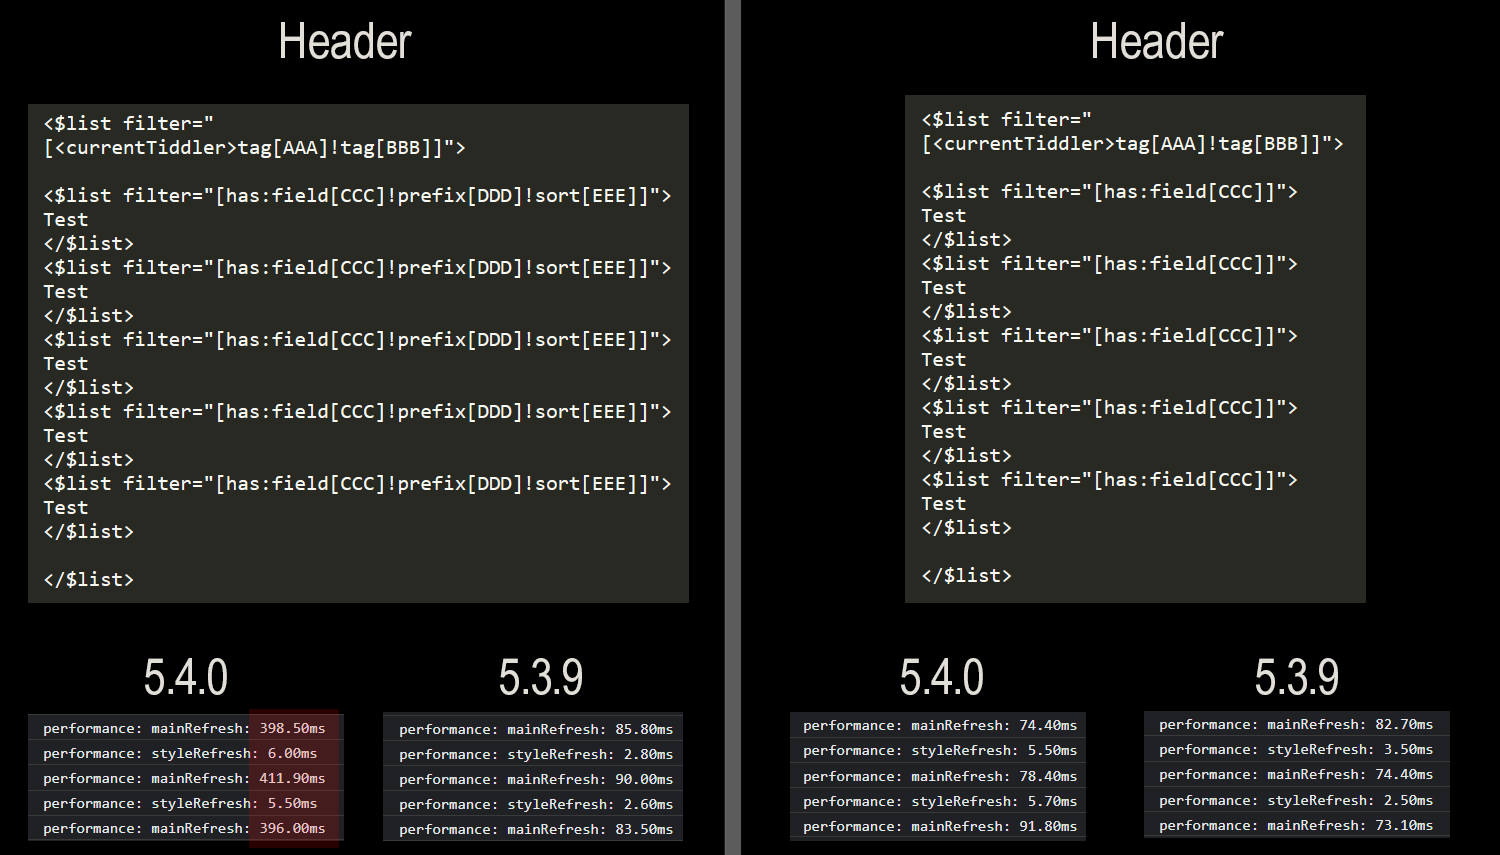
While trying to isolate the issue, I noticed that a filter run with extra steps makes the most dramatic difference. Is this due to additional parsing that is required by new filter features? I strictly use zoomin view; would an eventual “true single tiddler mode” be my saving grace for this use case?
I cannot think of anything off the top of my head that would explain the performance difference you are seeing. Are you able to share a wiki that shows this behaviour? or replcate the problem on tiddlywiki.com? Thank you.
Has anyone else noticed any performance issues compared to v5.3.8?
Not sure how to upload the TW, so this is the list of tiddlers for import: FilterPerformance.json (22.2 KB)
I made the following configuration changes to the empty.html:
Added Test1-Test150 to “Default tiddlers” list
Zoomin view, animation duration 0
Delay goes from 130ms to about 700ms in 5.4.0 when clicking around the test tiddlers in the sidebar’s “Open” list. The header is titled “Header” and filters 50 tiddlers with the prefix “FFF_” (x10 so delay is apparent).
Definitely much better! Not to split hairs, but just in case it changes the scope of the issue, it’s averaging around 240ms vs. 150ms on 1.3.8 with the sample tiddlers. Certainly much faster though, and perhaps negligible in the long run. Thank you!
Ah, I had been testing in TiddlyDesktop. The mainRefresh was +40ms vs. 5.3.8, but also lagged by an additional 100ms about 1/3 of the time.
I tested on a clean install of Chrome on a secondary machine and the 100ms lag is gone. I’m still seeing a ~35ms difference (95 vs. 130), but I doubt I would ever notice this under normal conditions. This is all in reference to mainRefresh.