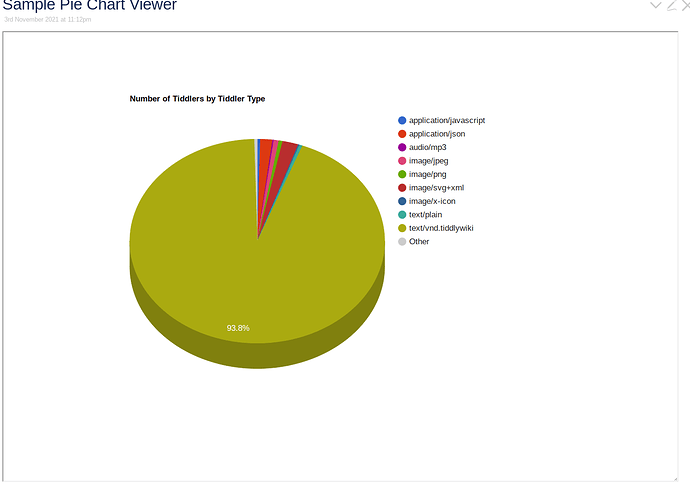
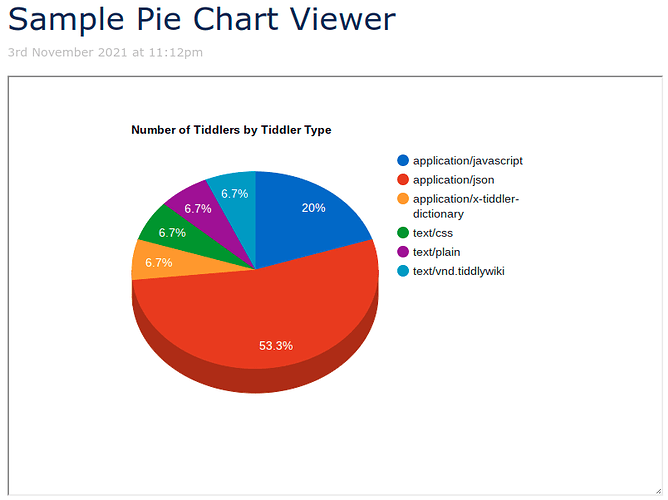
Download the attached json, and drag into some TiddlyWiki (TiddlyWiki.com!) to import three tiddlers:
- Pie Chart HTML
- Code sample from Google, with some modifications
- Some javascript added to handle regenerating a chart when the container is resized
- Some placeholders (?), for later search-replace by custom chart title and custom data
- Code sample from Google, with some modifications
- The Pie Chart Data
- The Google Pie Chart code needs a table of data to display; this tiddler is to build that table of data that will replace the relevant placeholder in the HTML
- Sample Pie Chart Viewer
- This is the tiddler with all the trickery
- an iframe to display HTML+CSS+javascript dynamically created and via the iframe “srcdoc” attribute
- the html fed to the iframe is a neat little filter that grabs the content of “Pie Chart HTML” and replaces the “Title” and “Data” placeholders with
- I got lazy: just the hard-coded title slapped right there in the filter
- The contents of a variable that wikifies the content of “The Pie Chart Data” tiddler"
- Notice that the iframe has a very faint grab handle on the bottom right-hand corner. Resizing the iframe causes the chart to be resized too. Likely not a big deal for folk who really know their stuff, but I’m patting myself on the back for that one.
- Hover over the chart itself to see details for each pie.
Using Google Charts in TiddlyWiki is very convenient, and really easy (I’m thinking or putting an interface together for what I’ve done so far, to make it even easier.
And it sure helps keep a TiddlyWiki instance really light by using an external charting service.
Not so great when off-line. But when I’m offline, I don’t have much use for any computer anyway …
Cheers !
PieChartWithGoogleCharts.json (1.92 KB)

