In general, I don’t really have any issues with the performance of my Kansas Railroad Wiki (certainly as far as navigating and using content). However, I’ve noticed that it takes about a second and a half to bring up the control panel with the plugin tab selected. I’ve also noticed that it takes about 2 seconds for the dropdown in the field name of the add new field area. In addition, it takes nearly 3 seconds for the dropdown to show when pressing on the tag pill for stylesheets. These last two are particularly annoying.
By the way, stripping the copyrighted content made no real difference in performance even though that included about 1700 tiddlers. I know I have quite a few plugins installed and I’m working to see which ones I can live without.
The advanced performance plugin hasn’t really helped me much (maybe I’m not using it to its full extent or correctly). When I look at the filter runs that the plugin lists, I don’t see how the times involved could add up to the times that it takes to complete. I’m obviously missing something.
I do need to try eliminating some plugins to see if there are any differences in performance of these areas, but haven’t had a chance to do so. I think that’s my next step.
Any other suggestions would be greatly appreciated.
@HistoryBuff I went you your example site, and tried the things you mentioned and did not see any delays beyond the load, I hope I was doing it the way you were for comparison, but no delays what so ever.
Latest Chrome Browser and FireFox
Windows 11 32GB Ram
I have personally and only occasionally found reducing open tabs, restarting the browser or the computer after experiencing slowdowns has corrected poor performance.
I think sometimes browsers can accrue issues over time like memory leaks.
Incidentally when on your site, I got hit with the following message using something in the edit menu.
Internal JavaScript Error
Well, this is embarrassing. It is recommended that you restart TiddlyWiki by refreshing your browser
ResizeObserver loop completed with undelivered notifications.
If you get errors like this and don’t reload the tab, or over time the browser, you can accumulate problems.
It is worth considering the environment your browser is in, many browsers try and minimise their memory usage on the computers they are running, where with tiddlywiki we are often happy to give browsers and thus tiddlywiki more ram.
Perhaps you could give some more precise test instruction steps we can undertake for comparison?
Sorry I don’t, if you present me a more specific set of test instructions I can explore then and report what I see, My main point was to refresh, tab/browser/computer to eliminate side effects.
@HistoryBuff I see the delay in the Control Panel loading. I’m struggling with the performance log plugin you are using. It is showing a mainrefresh of 2.4568 seconds, a total of 234 filters when I load the Control Panel. However, the detail filter tabs do not show this total time for the 234 filters (something significantly less) but it does show the correct number of filters executed. This would suggest the consumed time is not in the use of filters, but somewhere else. I just can’t figure out where.
I’m seeing different performance results depending on the default tab the Control Panel opens. For example, if I select Evidently Cube tab, close the Control Panel, and reopen it the Control Panel opens quickly, but where if I do this with the Plugin tab, that seems to be the worse performer.
Do any of these plugins attempt to communicate with other servers?
$:/plugins/flibbles/relink seems to load very slowly (especially the content tab)
Good point here. the performance of tiddlywiki relates to how much work you are asking it to do (what you see). If a sidebar tab is doing a lot and needs refreshing due to activity in the story it will be re-rendered every time a refresh is triggered.
There are ways to improve this by reducing the content visible or what triggers a refresh.
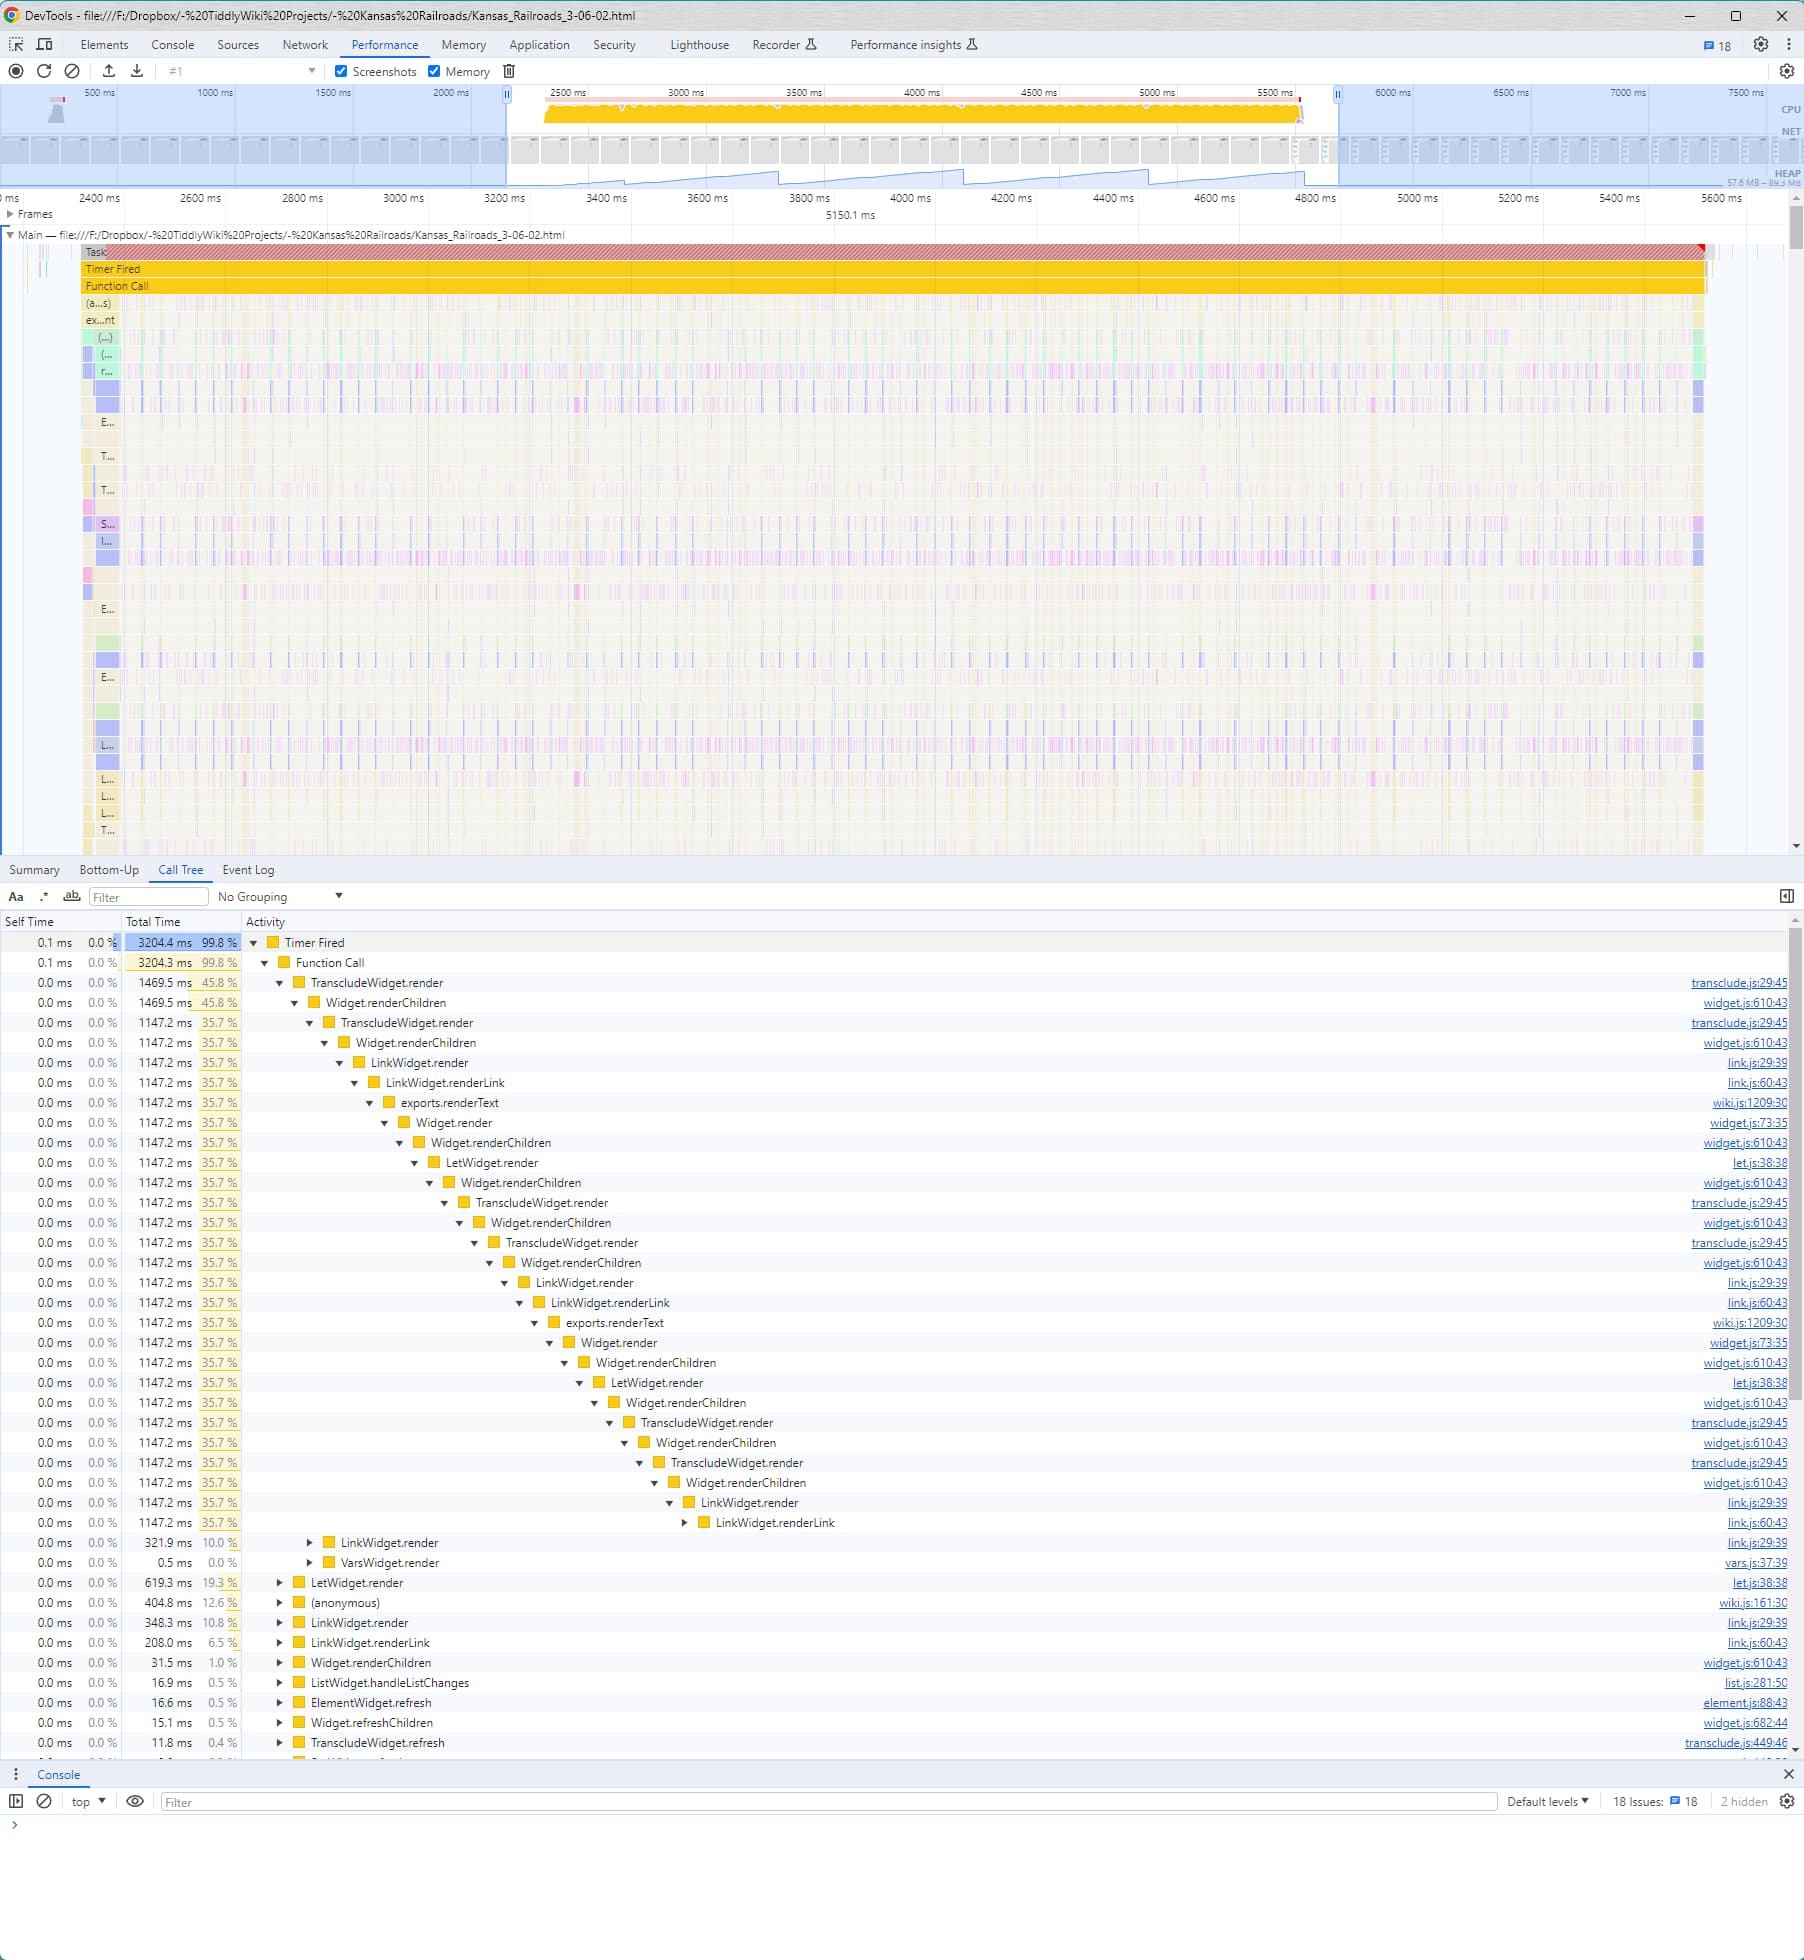
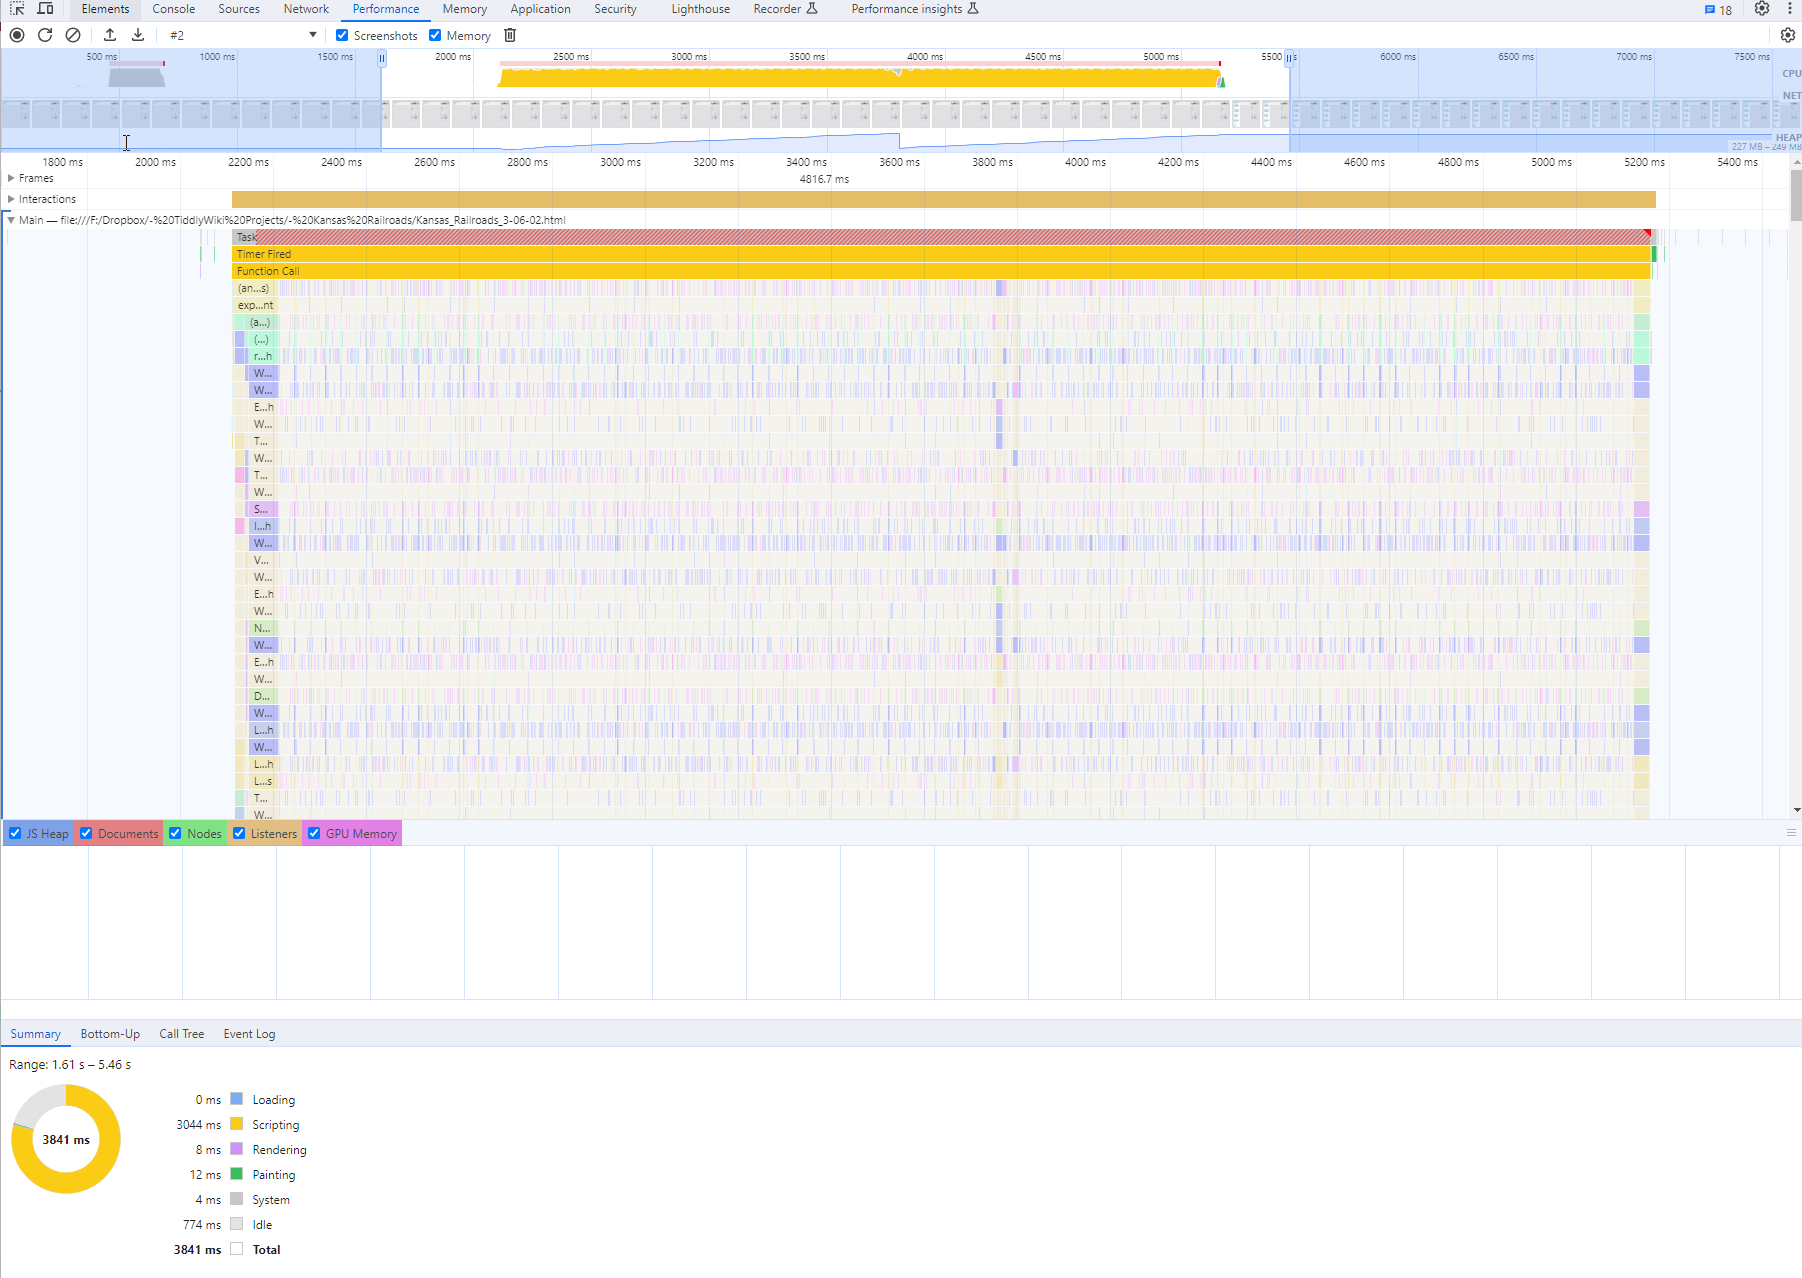
As an experiment, I switched the sidebar tab to the Views tab (minimal info there) and only had one tiddler open (Center Edit Text Styling). I used the developer tools/performance tab (Chrome) to record the clicking of the tag pill. The screenshots below show the results (which I’m not sure how to interpret). I tried doing the $tw.perf.log(), but it said to use the UI instead which I assumed was the performance tab.
My first impression is that there is some kind of iterative loop that times out.
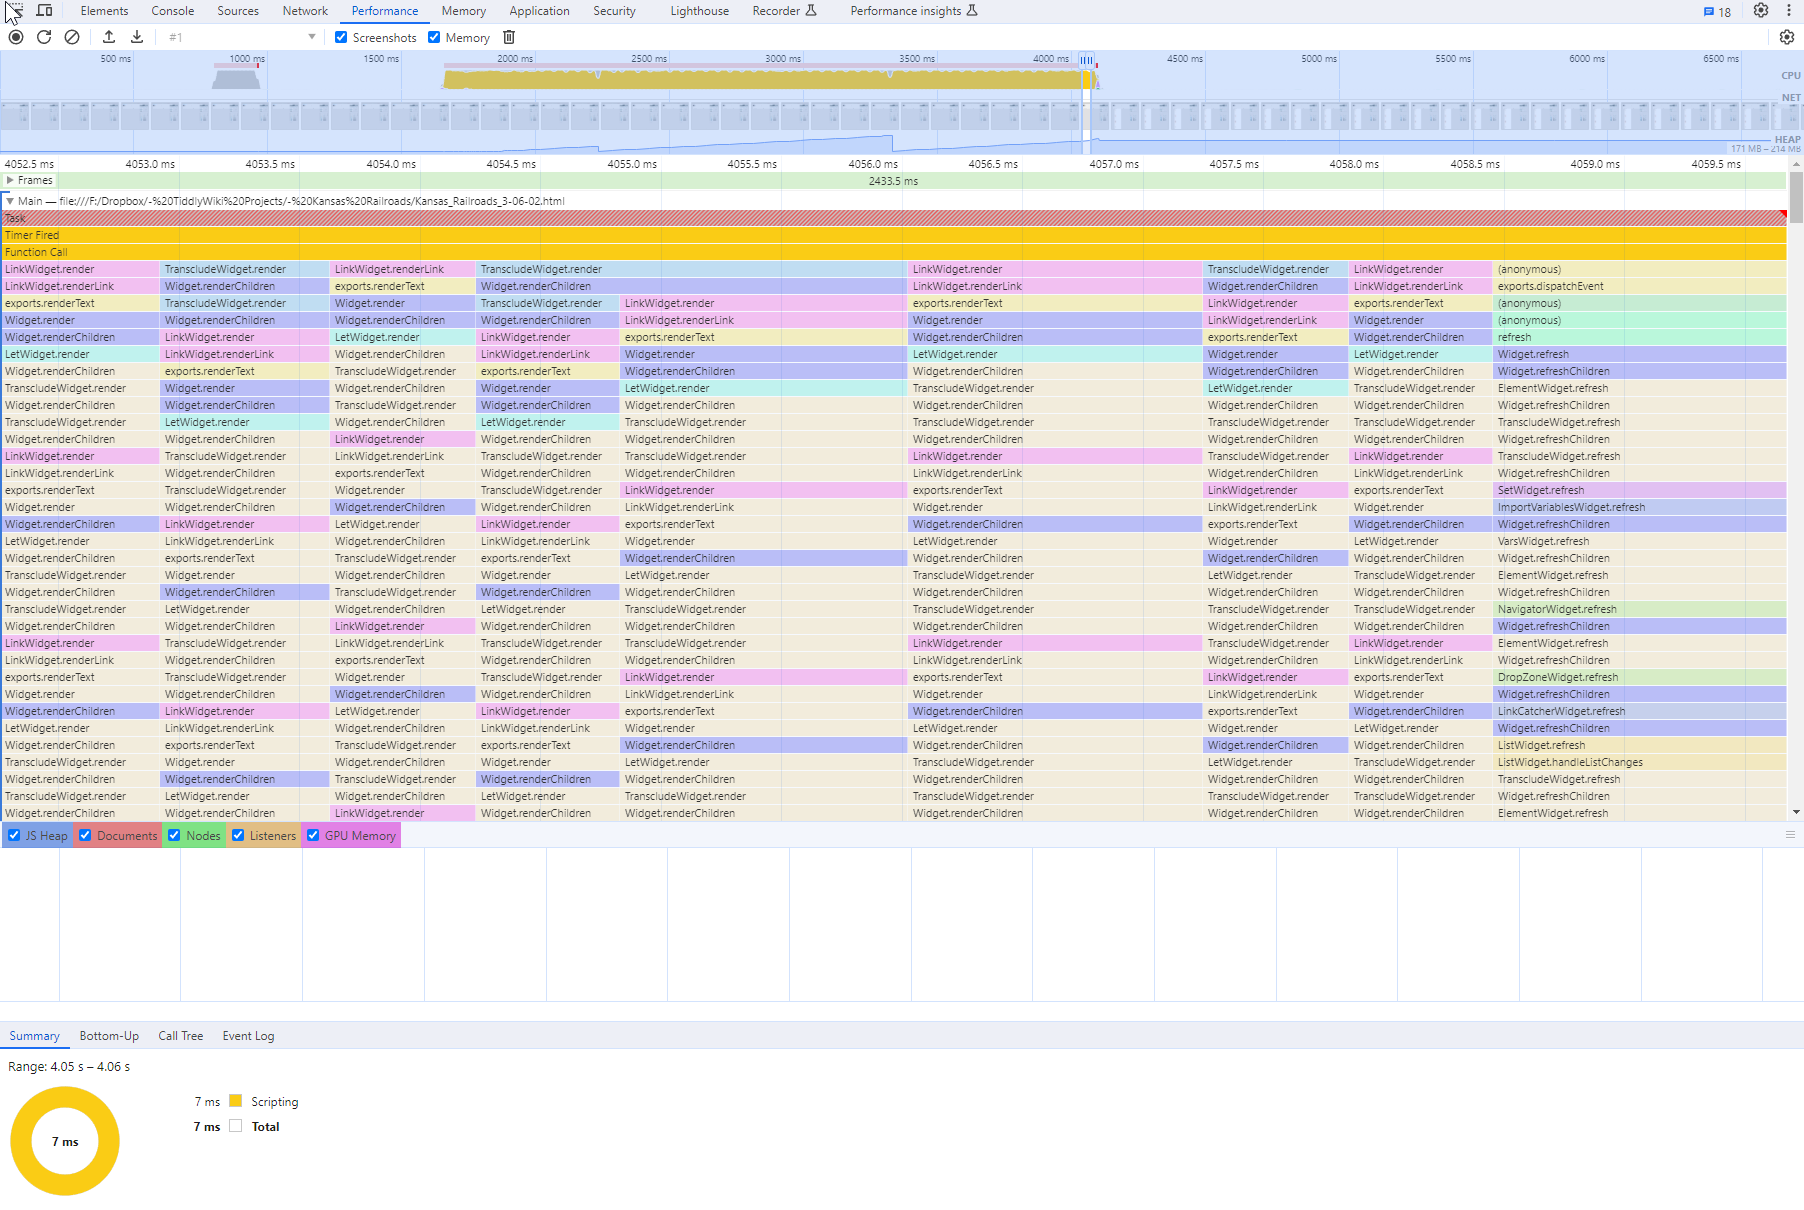
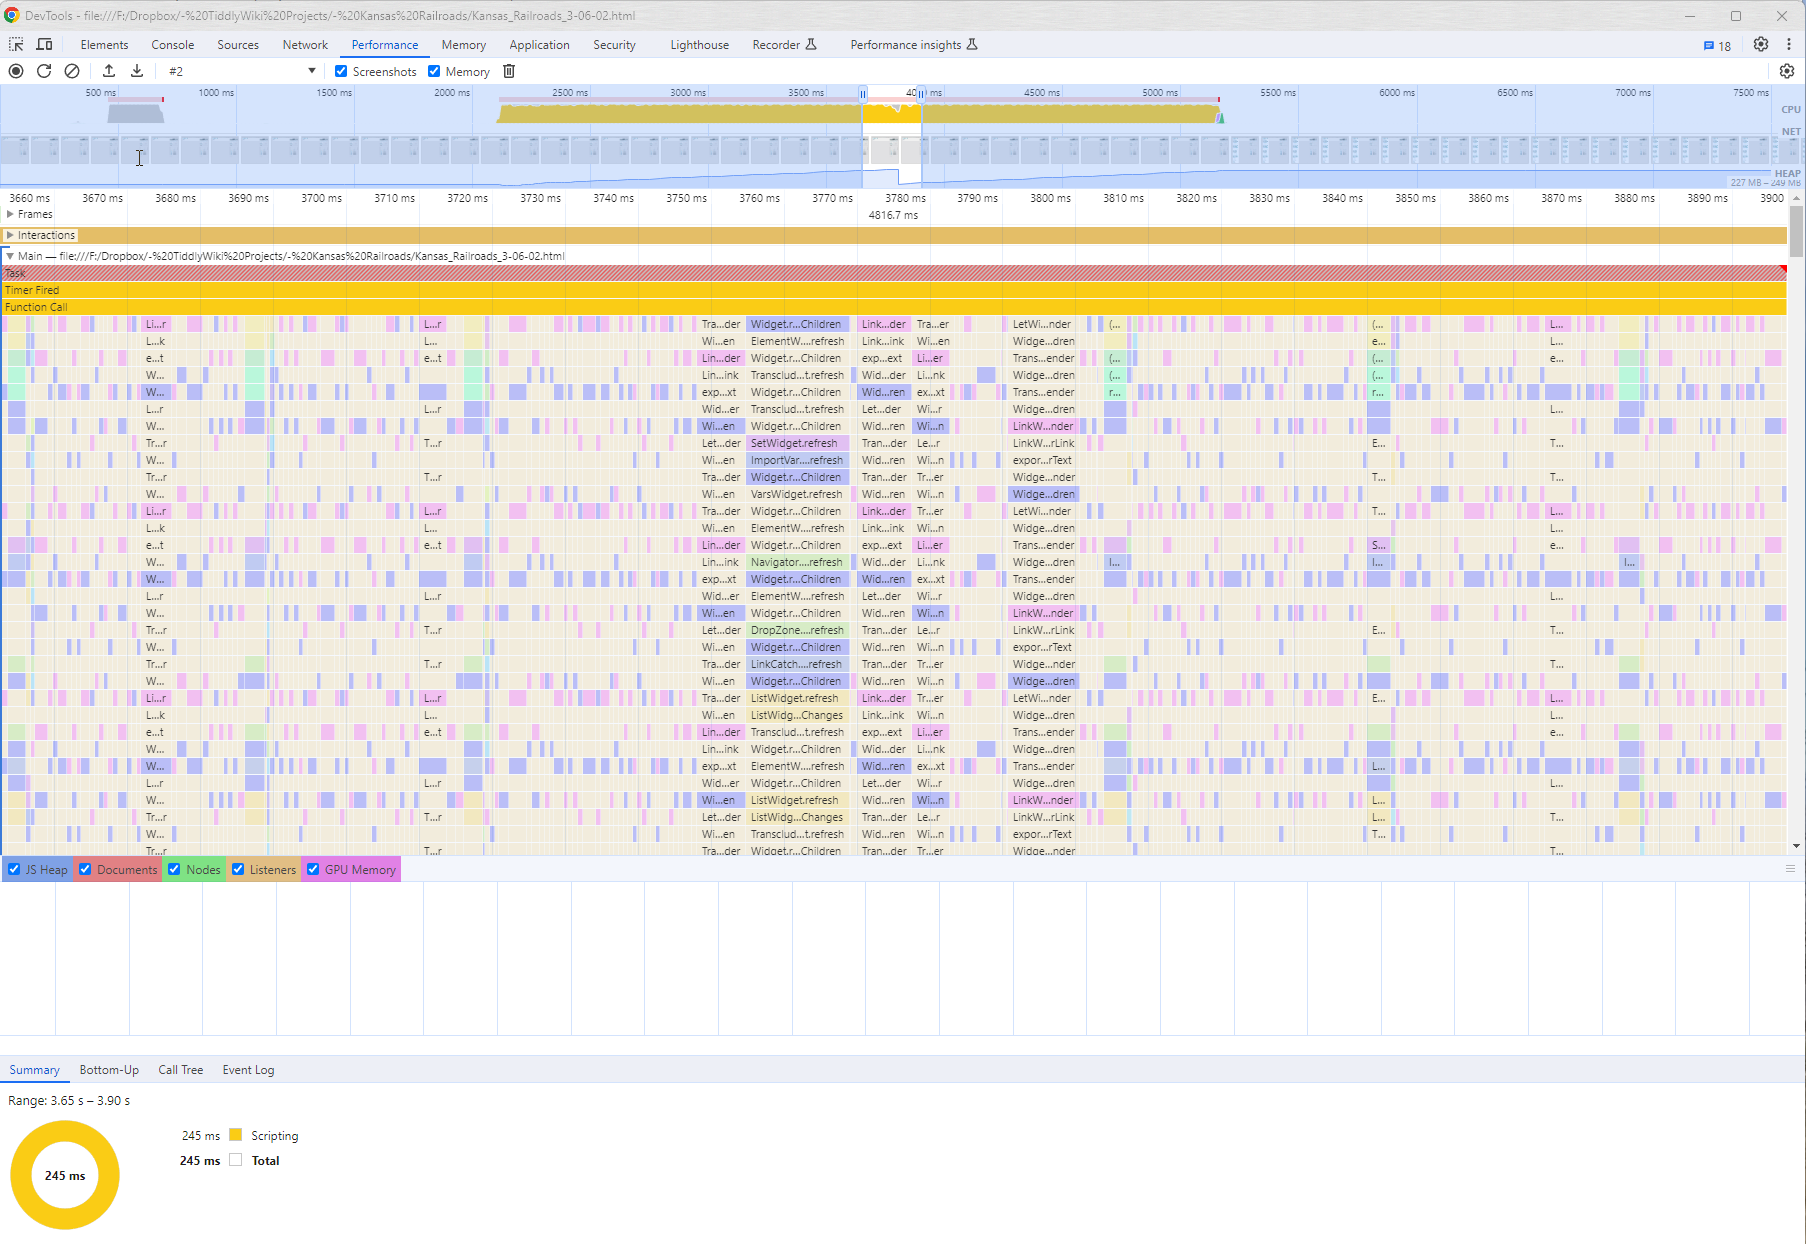
Here is a screenshot zoomed in on the time just as the dropdown is appearing. The dropdown appears just as the green refresh line shows up. This is a capture while clicking on the tag pill. It looks nearly identical when clicking in the new field name box waiting for the field dropdown to occur.
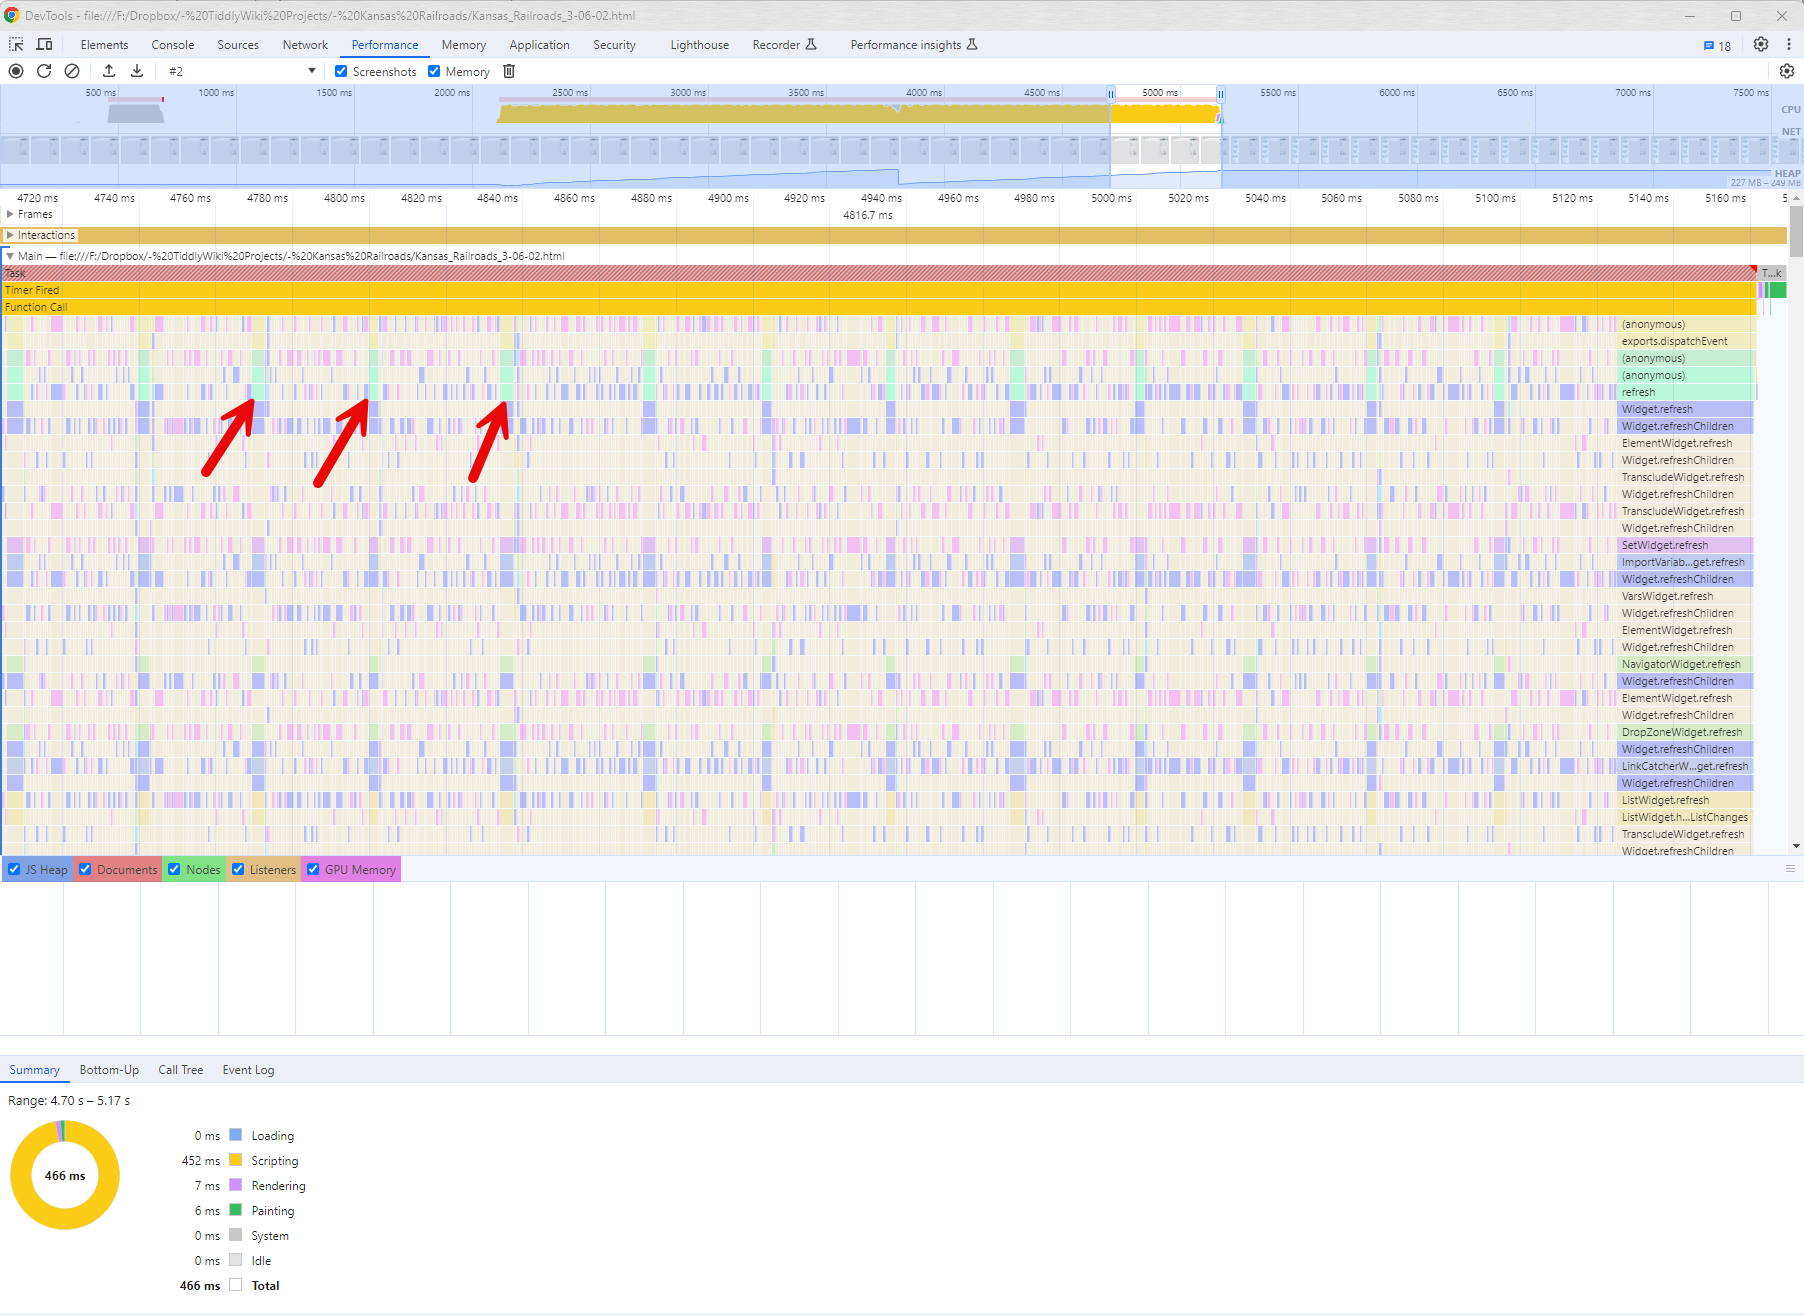
In this screenshot, you can see that the refresh seems to be trying to happen periodically (light green areas some of which are shown by the arrows). Not sure if this means anything or not. The dropdown shows up at the right of the screen where the activity stops changing.
This is a little to far from my own performance research however in such circumstances I would work through every tiddler involved in the tag pill drop down to see if there are any issues there in. Are the core tiddlers $:/core/macros/tag and
$:/core/ui/TagTemplate modified or in another plugin?
If so try copying (de tag) or deleting them and seeing if the performance improves even if you have to restore them and work through the details later, it will help identify where.
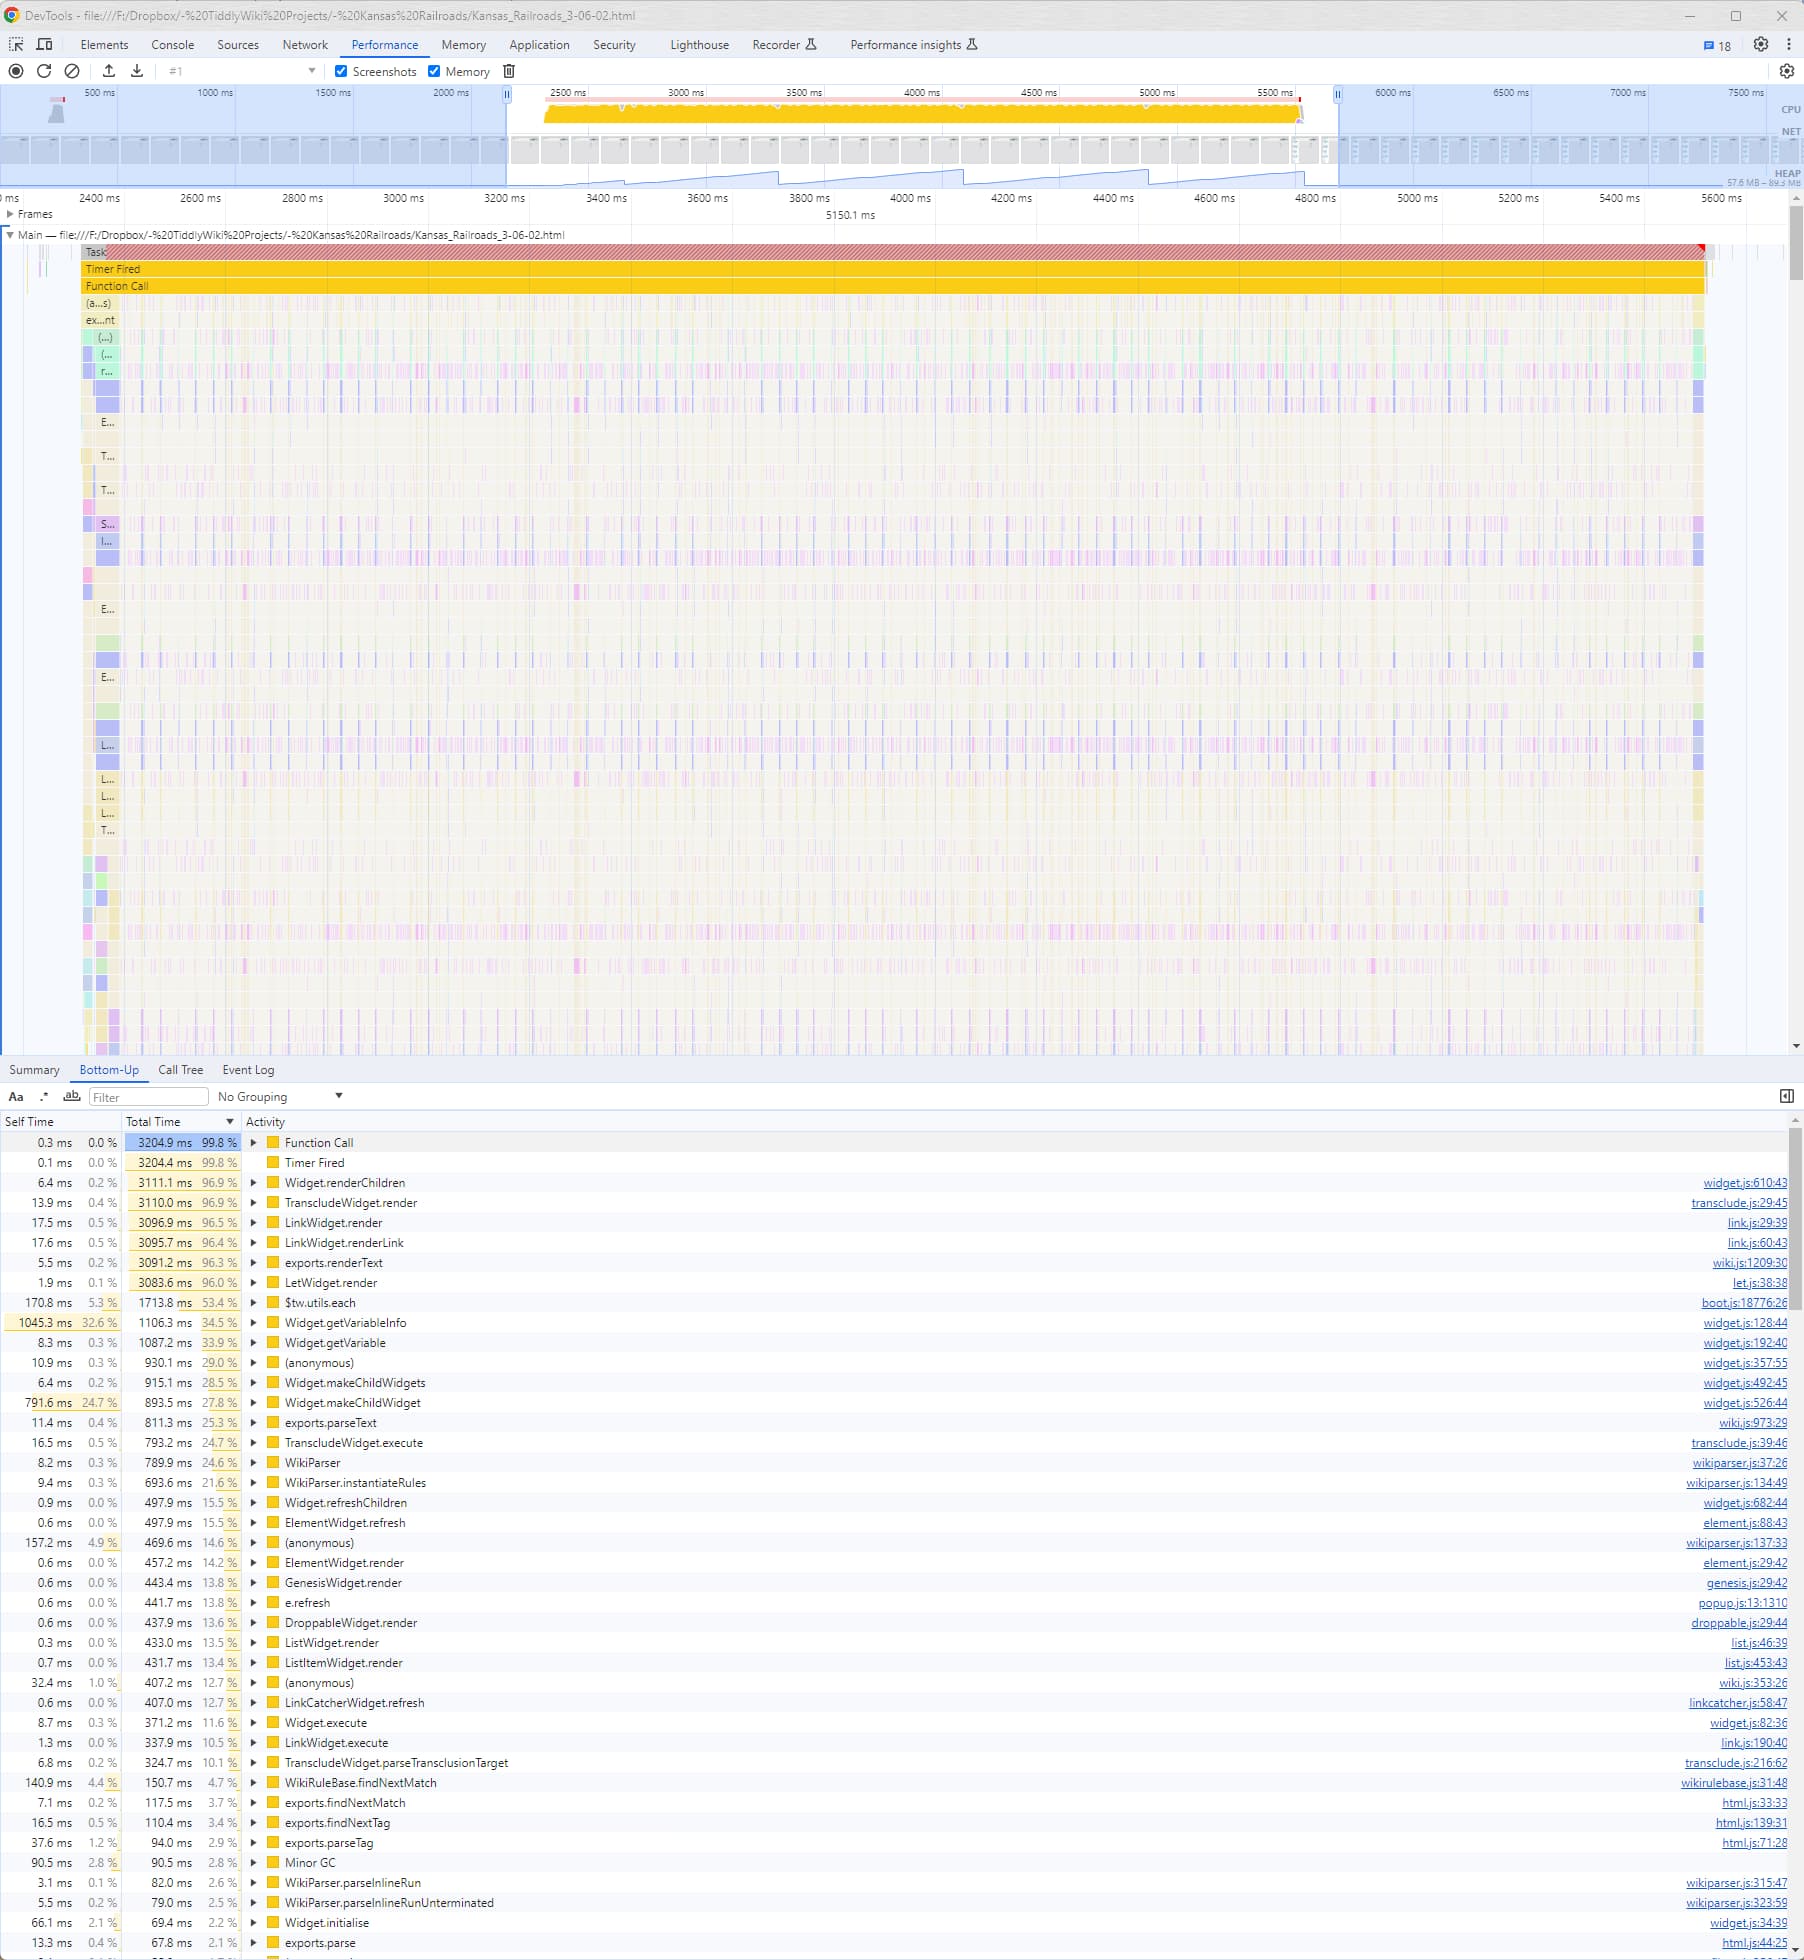
Although no expert it looks like there may be some kind of loop giving rise to the same thing occurring many times and the “size of the heap” line is suspicious, suggesting it fills up to more 249Mb the first being in the middle of the trace. This sounds too much.
Do you have any tiddlers using the $:/tags/TagDropdown ? because these are iterated when using the tag pill dropdown.
Perhaps if you took the functions being listed, in your performance list, and counted each (with tiddlywiki script) or just guess, identifying those that reoccur most often, you could search the tiddlywiki core to find where they are used, and thus which function, macro, widget etc… they live within. eg renderChildren however this seems to be javascript and has a lot of hits.
Update - I tried removing plugins to see if there were any causing issues. The only thing I found was that clicking the tag pill got a little faster. I suspect that’s because there were considerably fewer stylesheets. It did not affect the slow performance of the field name dropdown.
What I finally did that seemed to make the biggest difference was to export all of my content tiddlers and import them into an empty wiki. I then slowly added the plugins that I couldn’t live without. Before and after adding the plugins, the field name dropdown was considerably faster. So there must have been some garbage in there somewhere that was leftover that was causing the problem. I would have liked to have understood what it was, but it’s solved now and I’ve been kind of wanting to start clean anyway. I think I will do that periodically from now on.
I’ve also noticed some pretty extreme slowdown when using the field name dropdown in my own large wiki—so much so, in fact, that I eventually disabled the automatic dropdown, which more or less solves the problem.
I do think it’s likely that the plugin fields were contributing; each author uses their own ad hoc field names, so if you use a lot of plugins, you’ll probably end up with a large number of field names that are only in use in a handful of tiddlers (and sometimes as few as one!)
As an experiment, I rewrote a few of the list-generating filters in $:/core/ui/EditTemplate/fields to be—I think—slightly more efficient. If you like, you can experiment with this core overwrite:
A few other points I noticed in my quick scan of your wiki:
The Overwrite plugin is contributing not insignificantly; I’d recommend disabling it except when you’re about to upgrade your wiki.
The longest single filter—and one of the most frequently called during normal navigation—is [!is[system]!has[draft.of]!sort[modified]limit[1]], which seems to be in use in your Custom Site Subtitle, where you’re using to display the Last Modified time.
I suspect this is a relatively intensive calculation for an element that gets displayed all the time, since it has to sort all your non-system tiddlers repeatedly. I understand the appeal of a readily accessible timestamp, but removing it might make a noticeable difference.
The text.filter function in your “Completion Status” tiddler can be further optimized:
OLD VERSION:

\function text.filter()
[tag[Railroads]search:text[Charter Filed:]] :and[tag[Railroads]search:text[Volume:]] :and[tag[Railroads]search:text[Page:]]
\end

NEW VERSION
\function text.filter()
[tag[Railroads]search:text:literal[Charter Filed:]] +[search:text[Volume:]] +[search:text[Page:]]
\end
Each :and run is used to further restrict the output of the previous filter, so you don’t need to check for the “Railroads” tag more than once!
I’m also assuming that what you want is “Charter Filed:” as a phrase, not any tiddler than contains “charter” OR “filed:”. If so, using the :literal suffix will further restrict the tiddlers that get passed to the later steps.
Thanks for the reminder on that. I thought it would be useful, but found I actually never looked at much. It is now replaced with a link to my release notes.
I may just do an experiment with that. I will, at a minimum, look to see what you did.
That’s an excellent suggestion. There are probably several places where I could benefit from doing it that way. I have many filters in various places showing the railroads in different ways.
Thanks. I did notice that, but it links directly to the javascript which I know nothing about. I think I need to start learning javascript.