
Has anyone experimented with using TiddlyMap to create Causal Loop Diagrams (aka System Maps)? TiddlyMap looks extremely powerful and apt for this application – i am a baby-newbie  just beginning to learn TiddlyWiki, however, so if this is a totally dumb idea please let me know – TY!
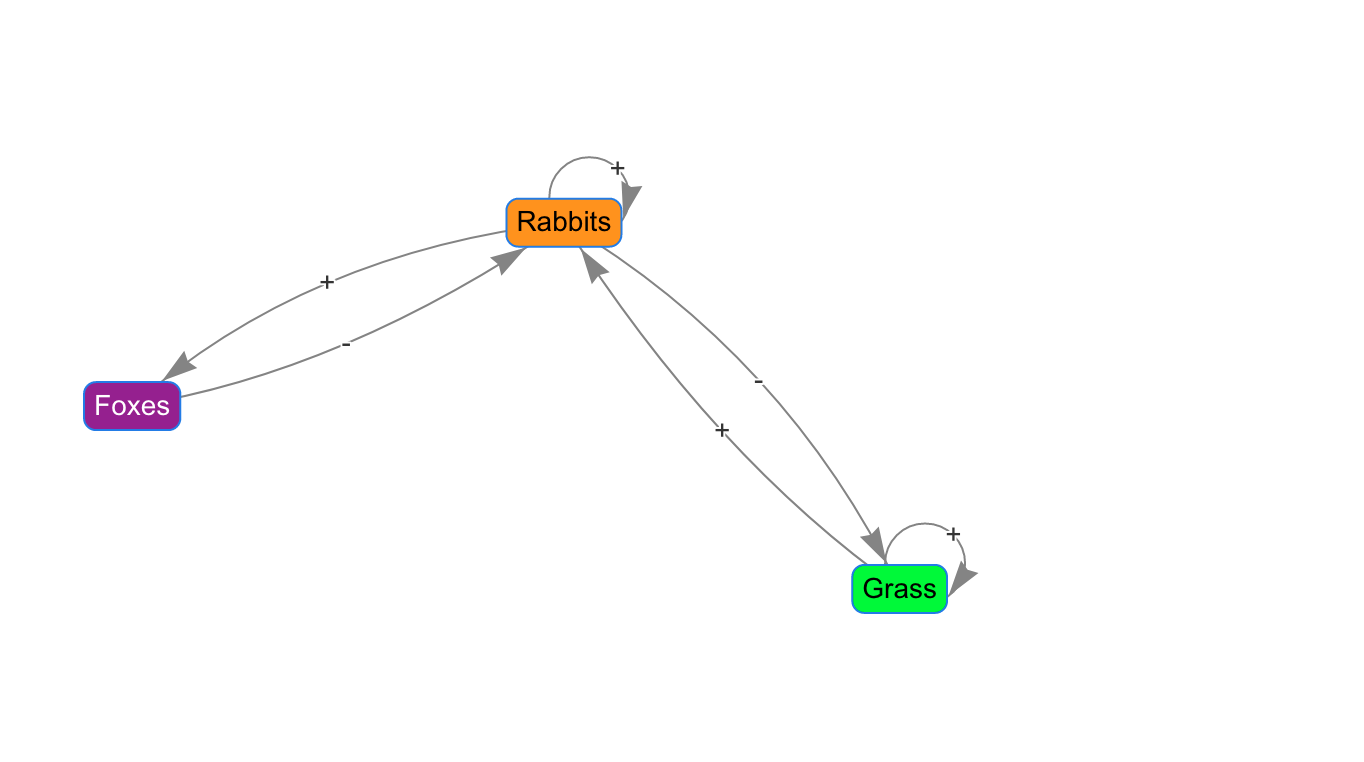
Briefly, to sketch CLDs one needs to create nodes and then draw arrows between them, which TiddlyMap seems perfect for. To turn a static CLD drawing into a dynamic live model, one needs to assign initial values to the nodes and then propagate those values via the arrows, which TiddlyWiki seems perfect for. (Funny footnote: when i drew a proto-CLD in TiddlyMap with a feedback loop from a node to itself, the TiddlyMap began to rotate slowly and i couldn’t figure out how to stop it spinning – duh! – see snapshot below)
Nano background links on CLDs and system mapping:
- Causal Loop Diagrams are a graphical language to visualize feedback loops and think about complex systems better (cf System Dynamics – CLDs are really a set of coupled differential equations, behind the curtain!)
- LOOPY by Nicky Case (2017) is a delightful-brilliant sketch-up tool for CLDs, but lacks many features and is mathematically unsound
- LOOPY2 from the MITRE Corporation (2018-2022) extends LOOPY in useful directions, but needs further work