Load Time Performance

This thread has been split from my previous topic, Practical Limits to Import.

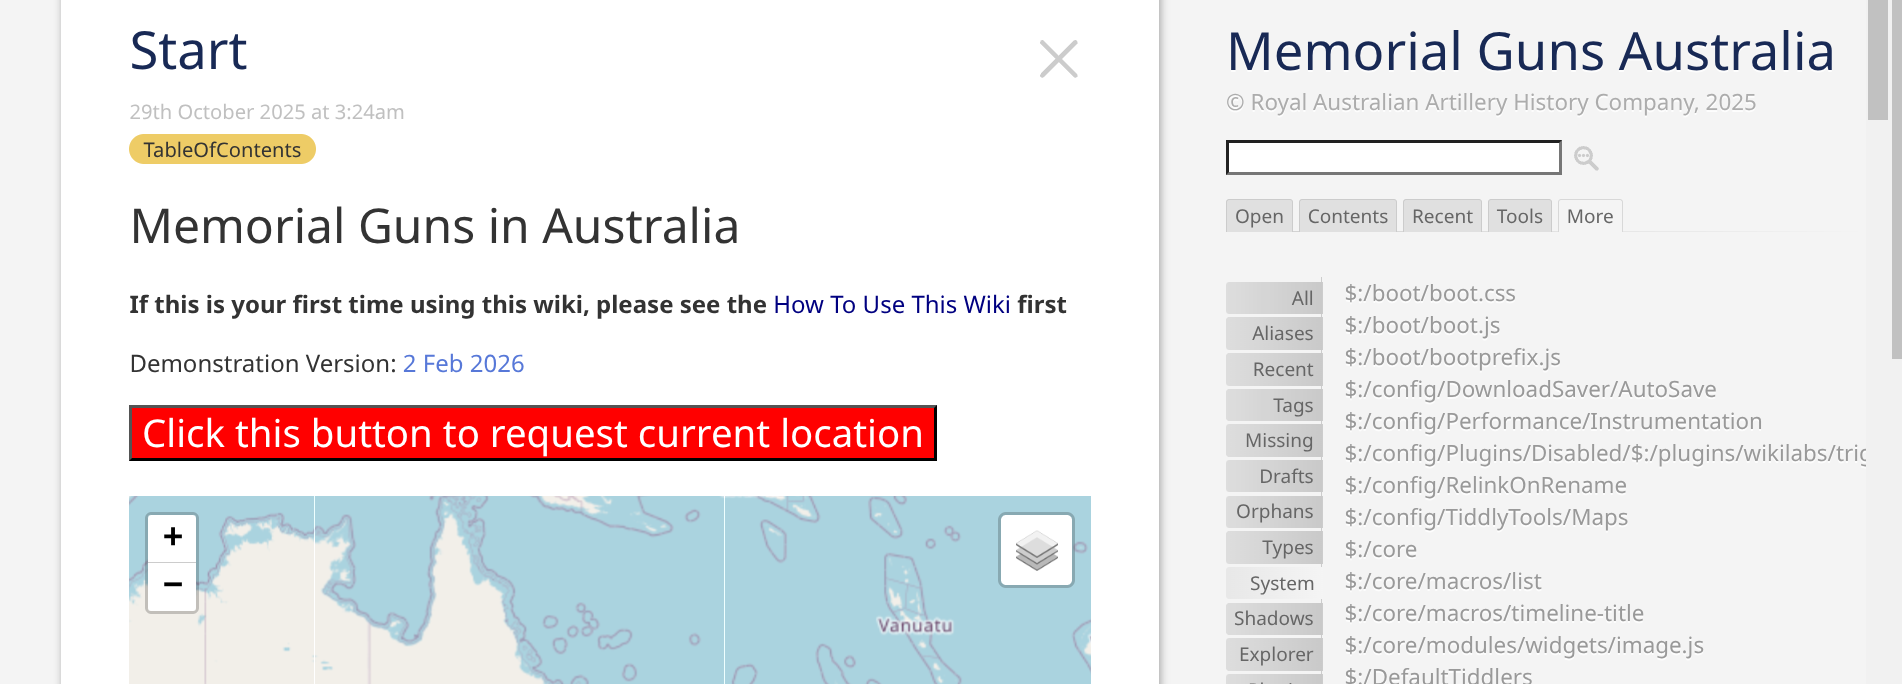
I have now setup a testing environment using the guns registered in South Australia.

However, I am concerned already about load response times and this is 150 guns (9.2MB) out of a current total of 2,000. Once loaded, individual response times are fast so that is good.

Could I ask someone/anyone/everyone to open the file and give me some idea as to opening times and machine/network specs.

Also, is there any info available on performance monitoring? Any tools I can use? Is the Advanced Performance plugin compatible with the latest version(s) of TW?

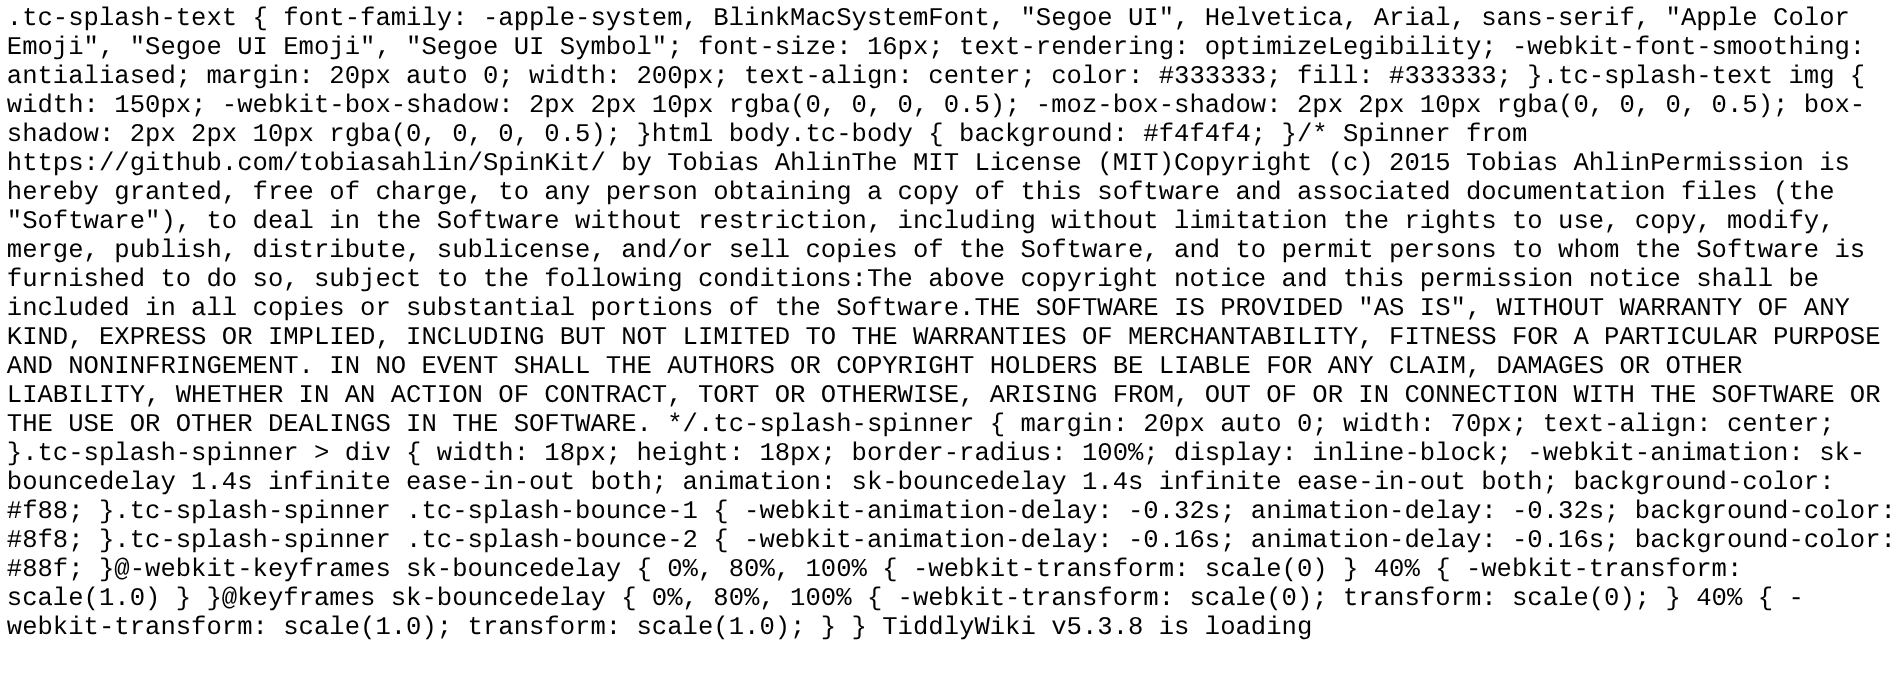
The text display at load time is me trying to install the splash screen example from tiddlywiki.com. No idea why this isn’t working.

bobj

If you load the page,

  • hit F12 to open the dev-tools
  • Select the Network tab
  • Click the browser reload

You’ll see, that it’s not your wiki, that causes the problem.
There seems to be a timeout between the second and the 3rd request, which seems to be servers side.

At least it looks like that for me. Tested in Austria.

Did you ever try to host the page on GitHub or on a different provider?

1 Like

It is weird! Some kind of bad server glitch? Dunno.

On my Chrome on a Chromebook clicking the link displays this at first …


After a long time it eventually loads and shows …

Bizarre, TT

It takes about 40 seconds from click on your link to the display of the page.

I thought so at first too, but when I downloaded the wiki and ran it off my file system, it had the same slowness and strange initial view that @TiddlyTitch noted.

@Bob_Jansen: Can you export all your tiddlers and import them into an empty edition and see if this slowness still happens?

1 Like

I tried this, using this filter (which I imagine is missing things):

$:/SiteSubtitle $:/SiteTitle $:/DefaultTiddlers  
[prefix[$:/plugins]] [all[tiddlers]prefix[$:/TLS]] 
[all[tiddlers]!is[system]] 
[all[shadows]is[tiddler]] 

I still got the slowdown, although oddly not the weird initial screen I got on the server.

So I played around with disabling plugins. When I disabled only uni-link, everything worked fine.

I know uni-link is fairly battle-tested, so I would guess this has something to do with how you’re using it, but perhaps not. You might reach out to @pmario to see if he has any ideas why.

@Scott_Sauyet , I installed the plugin to see what it would do for me but I am not using it at all but I guess it is still active. Will try and disable it and see if your suggestion is right.

Certainly though, this wiki version has been through many trials and it is probably the time to dump it all out and try start with a fresh version.

1 Like

Scott’s mention of uni-link inspired me to take a look, partly because I’ve previously experienced some pretty drastic slowdown with uni-link myself — but only when using the aliasbacklinks filter operator in particular. I’d wondered if you were having the same issue, but you don’t seem to be using any of the uni-link-specific filter operators at all, so I had to abandon that guess.

I do notice that doing a filter search for [aliases[]enlist-input[]count[]] returns “4963” — i.e., the number of individual aliases that are presumably getting indexed on startup. That’s a large number, but not one that I’d expect to result in that much slowdown. I’ve been an avid uni-link user for a number of years myself, so I did a similar search in my own largest wiki (~30MB, 28026 tiddlers at present, typically less than 10s of load time for a very complex template) and got a total of 37458 aliases. Now, I only ever load my wiki over a LAN, so it’s difficult to make a straight comparison… but I’d suspect that uni-link is not the (sole) culprit. Maybe someone more familiar with Neocities can speak to whether this is typical for files hosted on their servers.

Incidentally, your splash screen (?) currently seems to be broken; I’m seeing a block of unrendered CSS and legal disclaimers at the bottom of the page.

I have no idea why, but uni-link does seem to be working single-handedly here.

I opened the original, loaded the control panel (by appending #%24%3A%2FControlPanel to the URL), disabled uni-link, and saved a copy.

That copy loads in about 2 seconds, although that unfortunate splash screen still comes up first.

I posted that copy to my cheap webhost if you want to look at it.

Again, I don’t know uni-link well enough to offer any suggestions about the slowdown. But if you’re not using it, then it might not even be worth chasing down now. (@pmario might disagree!)

Same weird prelim code block showing.
Loads a bit faster than @Bob_Jansen’s server.

Given the repeated glitch the fault must be in the TW?

TT

Only a bit? For me it was quite substantial.