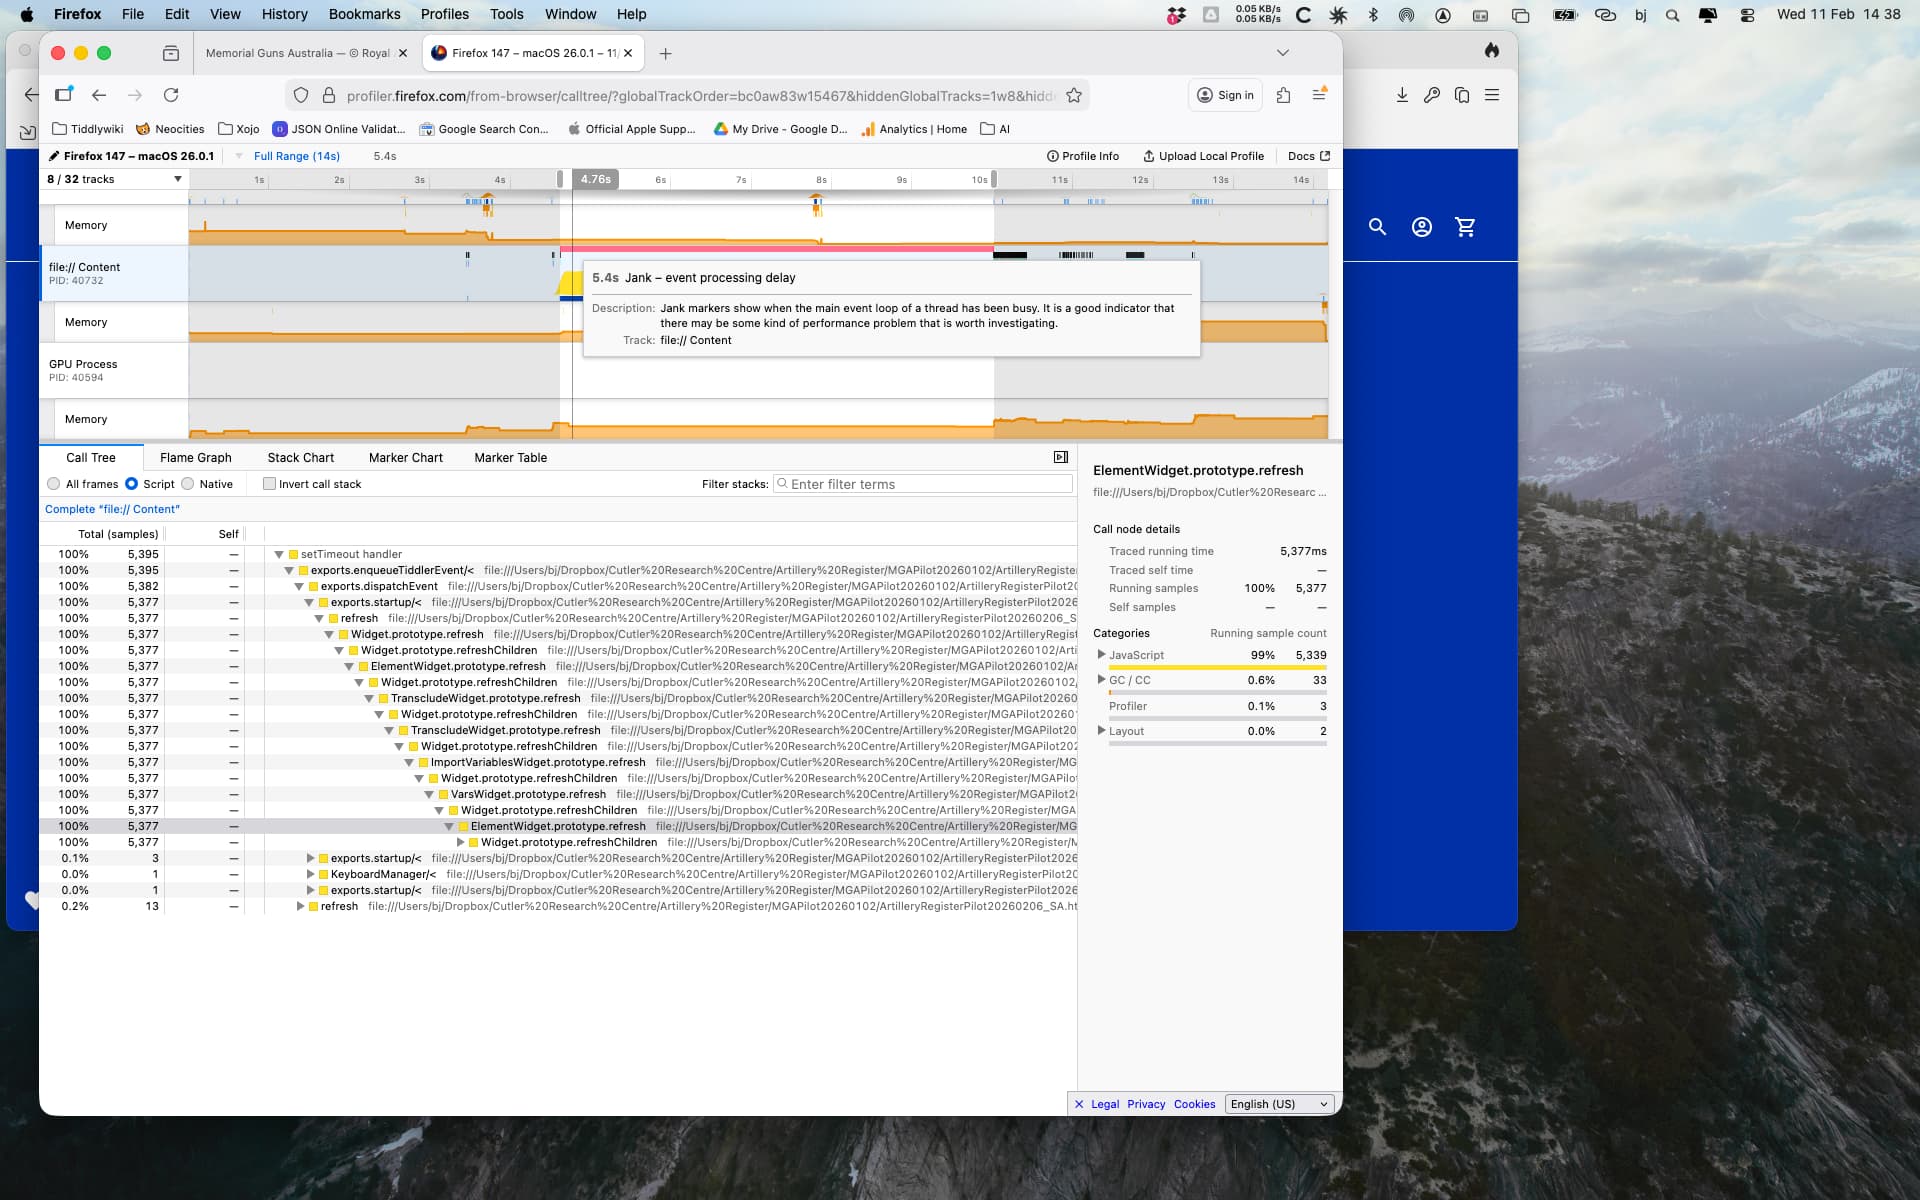
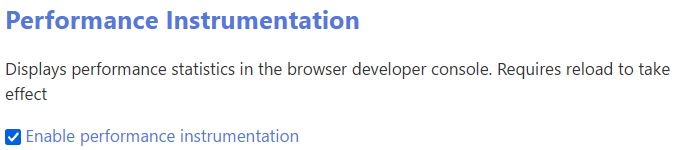
@Bob_Jansen, I’d generally suggest installing the Advanced Performance plugin to investigate performance issues; it’s likely to give you more actionable information than your browser debugger. (Note that you’ll have to save and reload your wiki after installing, and again after enabling the Performance Instrumention setting in Control Panel > Settings > TiddlyWiki.)
To use Advanced Performance, just click around in your wiki to establish a pattern of “baseline” use, then try loading any tiddlers where you’ve observed slowdown. In this case, the only tiddler that appeared by default was “Memorial Guns in Australia” (no noticeable lag on my machine)… but navigating to “Australian Capital Territory : Campbell - Colonial 64-Pounder Anti-ship Cannons” via your TOC did produce several seconds of lag.
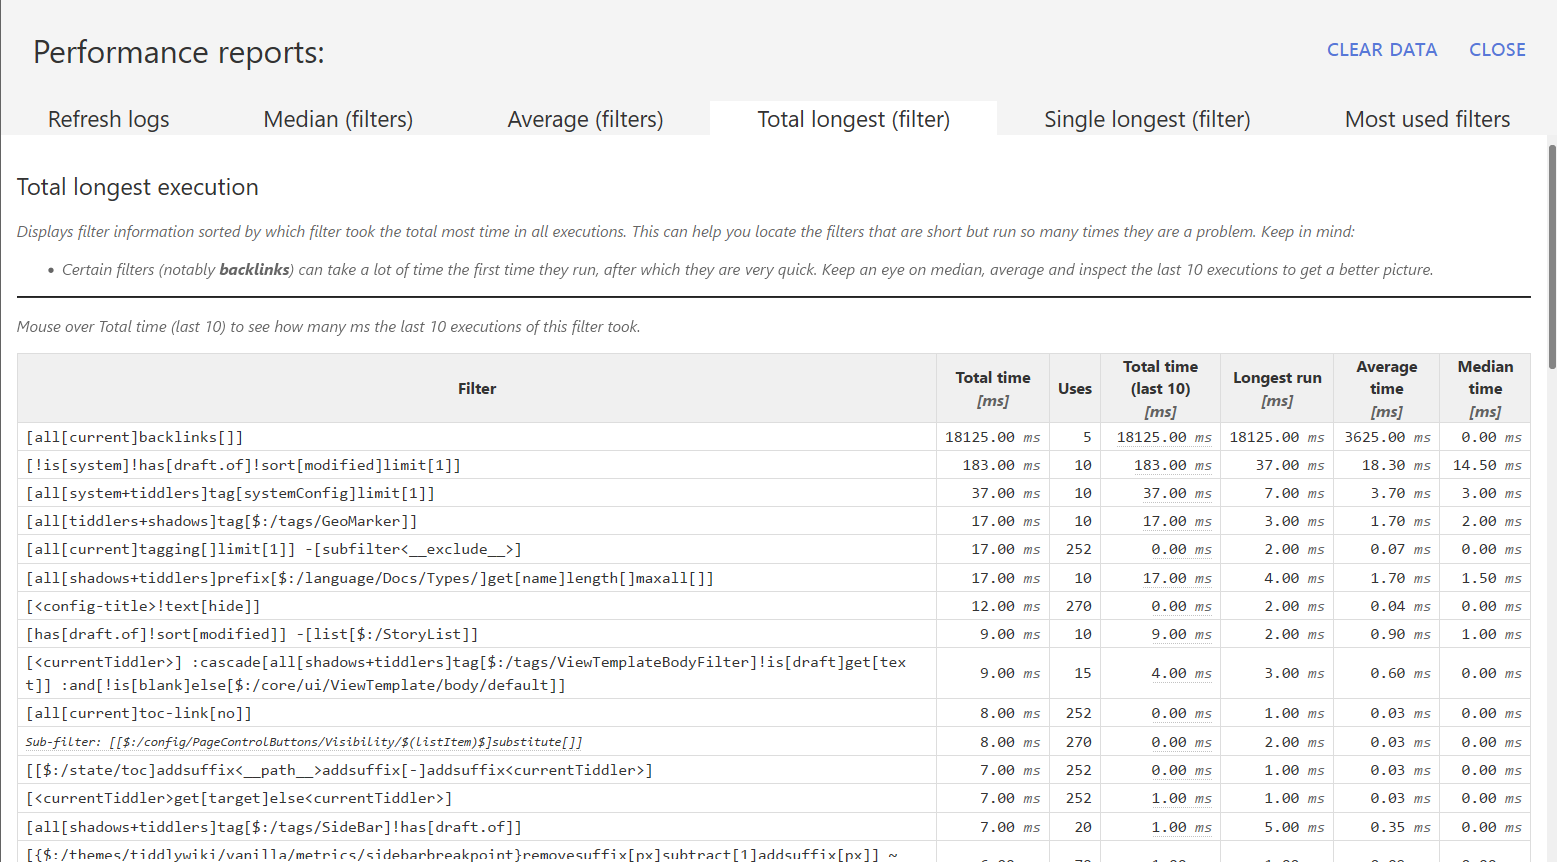
I then clicked on “Show details” in the Advanced Performance footer and navigated to the “total longest” tab. You may be interested in any/all of the tab reports, as it’s useful to consider both which filters are more time-intensive and how often they’re actually run, but I generally find “total longest” is a good place to start.
This indicated that — as you suspected — your use of backlinks[] is likely to be the culprit. This is consistent with your observation that the first “content” tiddler is much slower to load than subsequent tiddlers: once the wiki has constructed a temporary backlinks index, subsequent uses of the backlinks operator will be much faster.
Once I’ve identified a filter that may need refinement, I paste that filter (or a segment thereof) into Advanced Search to find the source tiddler(s). In this case, that led me to $:/TLS/Procedures. As an experiment, I removed the procedure that used [all[current]backlinks[]], reloaded the wiki, and noticed an immediate performance improvement. So if this were my own wiki, I would now be reconsidering whether a) I can remove this expensive macro from my ViewTemplates, and b) if not, whether I can move it someplace where it won’t need to run on initial tiddler load — say, behind a $reveal triggered by $button interaction, or inside a tab that’s not loaded by default.
Once you’ve successfully diagnosed an issue, you can remove the Advanced Performance plugin — or just uncheck the “performance instrumentation” setting, so the plugin remains available but unobtrusive for users who don’t know to look for it.
Hope this helps!