Hi @Noushka — I found this a fun problem, so rather than just describe an approach I built a small proof-of-concept you can poke at:
 Live demo: Exercise Log
Start on the Overview tiddler, then try Log Session and Progress.
The short recommendation
@TW_Tones’ instinct — a tiddler per session — is the right starting point. I’d push it one step further: make the atomic unit one tiddler per data point, rather than one field per exercise on the session tiddler. It creates more tiddlers, but every metric ends up in a flat, regular field, which is what makes the data trivially queryable and graphable later. That queryability is really the whole game here.
Two kinds of tiddler
Definitions (you maintain these — they’re your reusable vocabulary):
- Exercise — lists the
metrics to capture (e.g. Reps Weight Sets) and the muscles it works
- Metric — a measurable quantity, with
caption, unit, type
- Muscle
Log data (the form writes these; I tucked them under $:/log/... so they stay out of the way):
- a session →
$:/log/2026-06-15 (kind: session)
- a performance datapoint →
$:/log/2026-06-15/Squat (kind: perf), one per session×exercise, with a flat field per metric (Reps, Weight, Sets)
- a soreness datapoint →
$:/log/2026-06-15/soreness/Quads (kind: soreness), one per session×muscle
An Exercise lists the muscles it works, but only to pre-seed the soreness inputs — you can still add any other muscle ad-hoc (the classic “why are my calves sore after curls?” case).
Why one-tiddler-per-datapoint
Because the fields are flat and each datapoint carries its own date, any series you’d want is a one-line filter. The progress table for an exercise is literally:
[kind[perf]exercise[Squat]sort[date]]
…reading get[Weight] for each row. The muscle-soreness matrix is the same idea on the soreness datapoints.
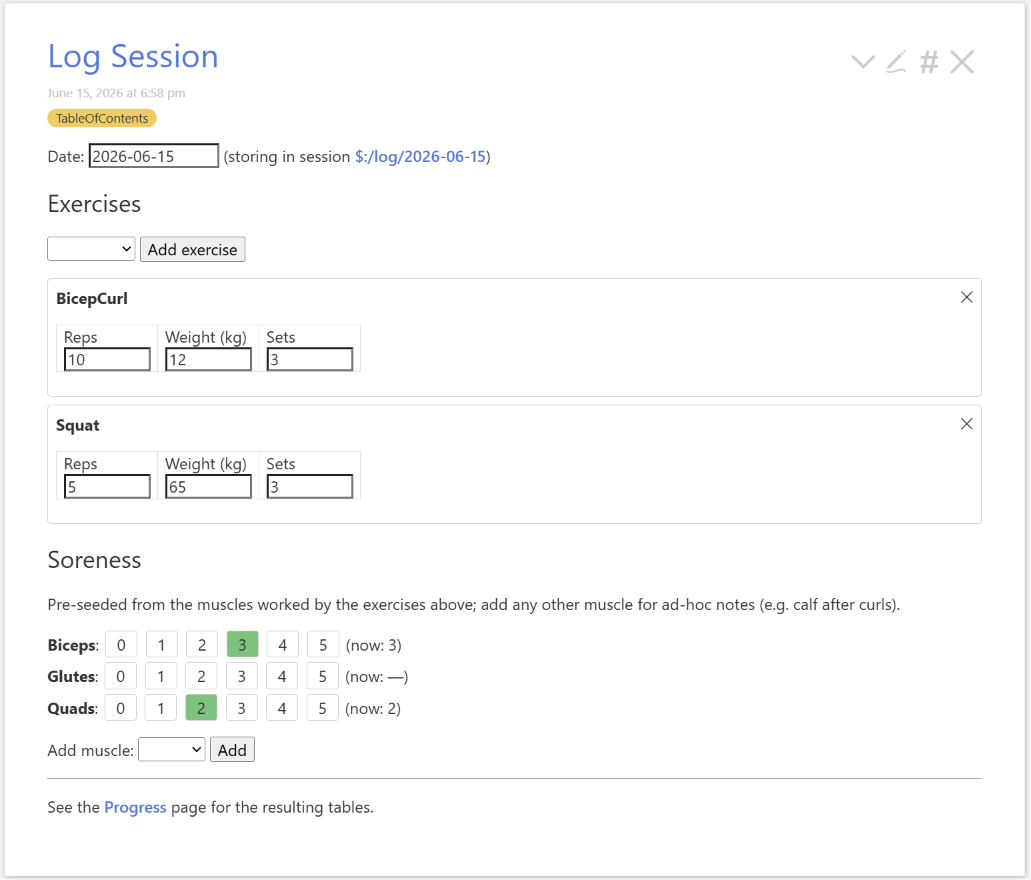
 Screenshot 1 — the Log Session form: dropdown to add exercises, metric inputs per exercise, and the 0–5 soreness pickers (pre-seeded muscles + an “add muscle” picker).
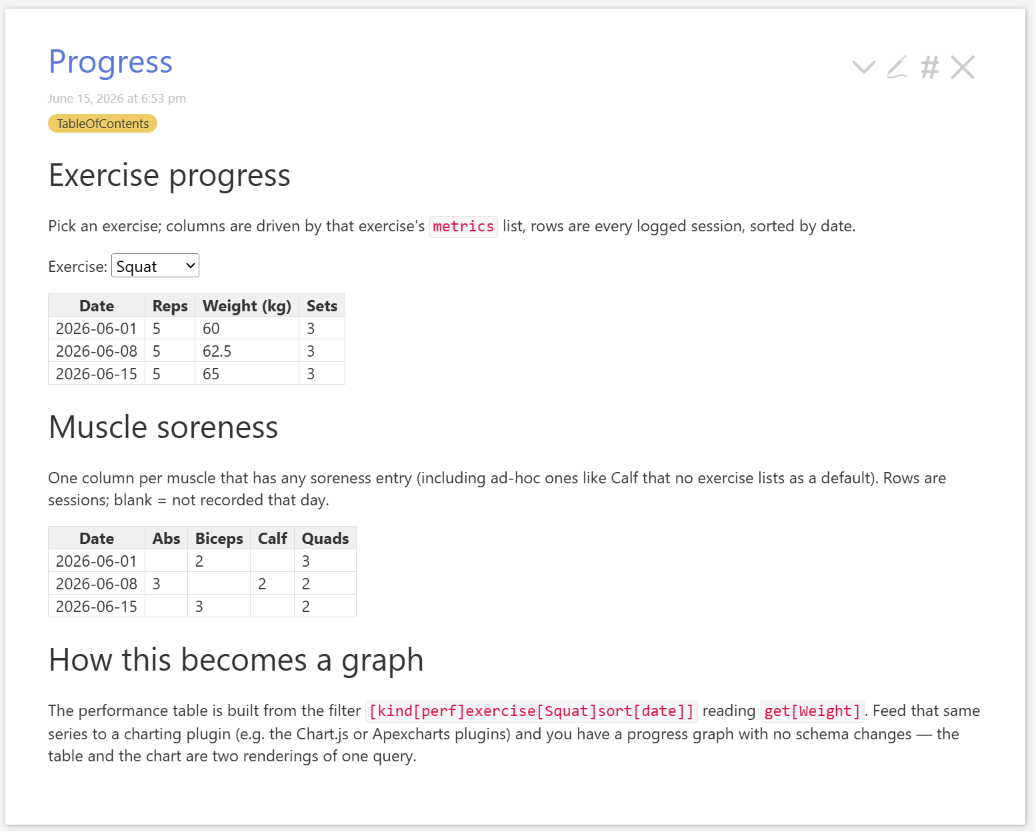
Screenshot 2 — the Progress page: the per-exercise progress table (columns driven by that exercise’s metrics list) and the soreness matrix (one column per muscle that’s been logged).
Graphs and a dashboard are a small step from here
I deliberately stopped at tables, but the point is that a chart is just a second rendering of the same filter. Feed [kind[perf]exercise[Squat]sort[date]] / get[Weight] into any of the charting plugins (Chart.js, Apexcharts, etc.) and you have a progress graph with zero schema changes. Likewise, the Progress page could easily grow into a dashboard — per-muscle weekly volume, “days since last trained”, soreness trends — all just more filters over the same datapoints.
On archiving old entries
You asked about summarising/archiving after ~6 months. With this model you mostly don’t need to: since every datapoint has a date, “last 6 months” is just a filter, and old data doesn’t slow down recent views. If you did want a rolled-up summary tiddler, that’s again just a filter over a date range — the raw datapoints can stay or go independently.
A couple of implementation notes for anyone building similar
- Enter ratings with buttons, not a bare
<$edit-text>. A button’s <$action-setfield> can stamp kind, date, session, muscle and the value together. A plain edit-text would create a soreness tiddler missing kind: soreness, so it’d silently vanish from every [kind[soreness]...] query.
get[…] doesn’t de-duplicate, so the “list of muscles worked today” needs a unique[] (or each[]) — otherwise you get a column per entry instead of per muscle.
This is very much a proof of concept 
It demonstrates the data model and the round-trip (enter → query → display), but a “real” version would want plenty more: input validation and units, editing/managing the definitions from the UI, handling more than one session per day, nicer styling, the actual charts, maybe per-set logging rather than aggregate, bodyweight/RPE/rest tracking, and so on. Treat it as a skeleton to argue about rather than something to use as-is.


 !
! .
.
 . TiddlyWiki opened a new world for me