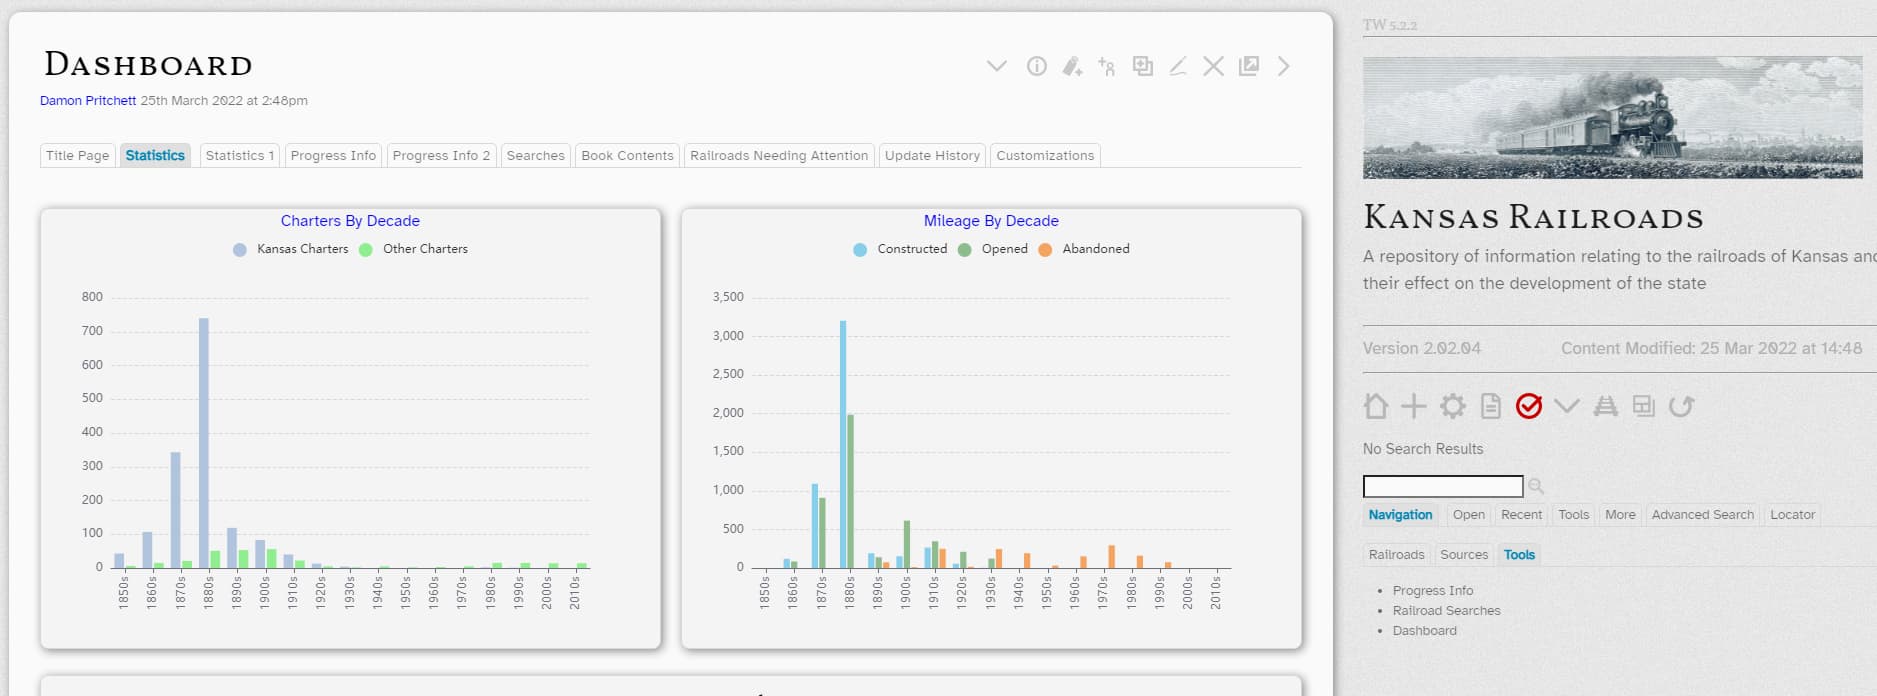
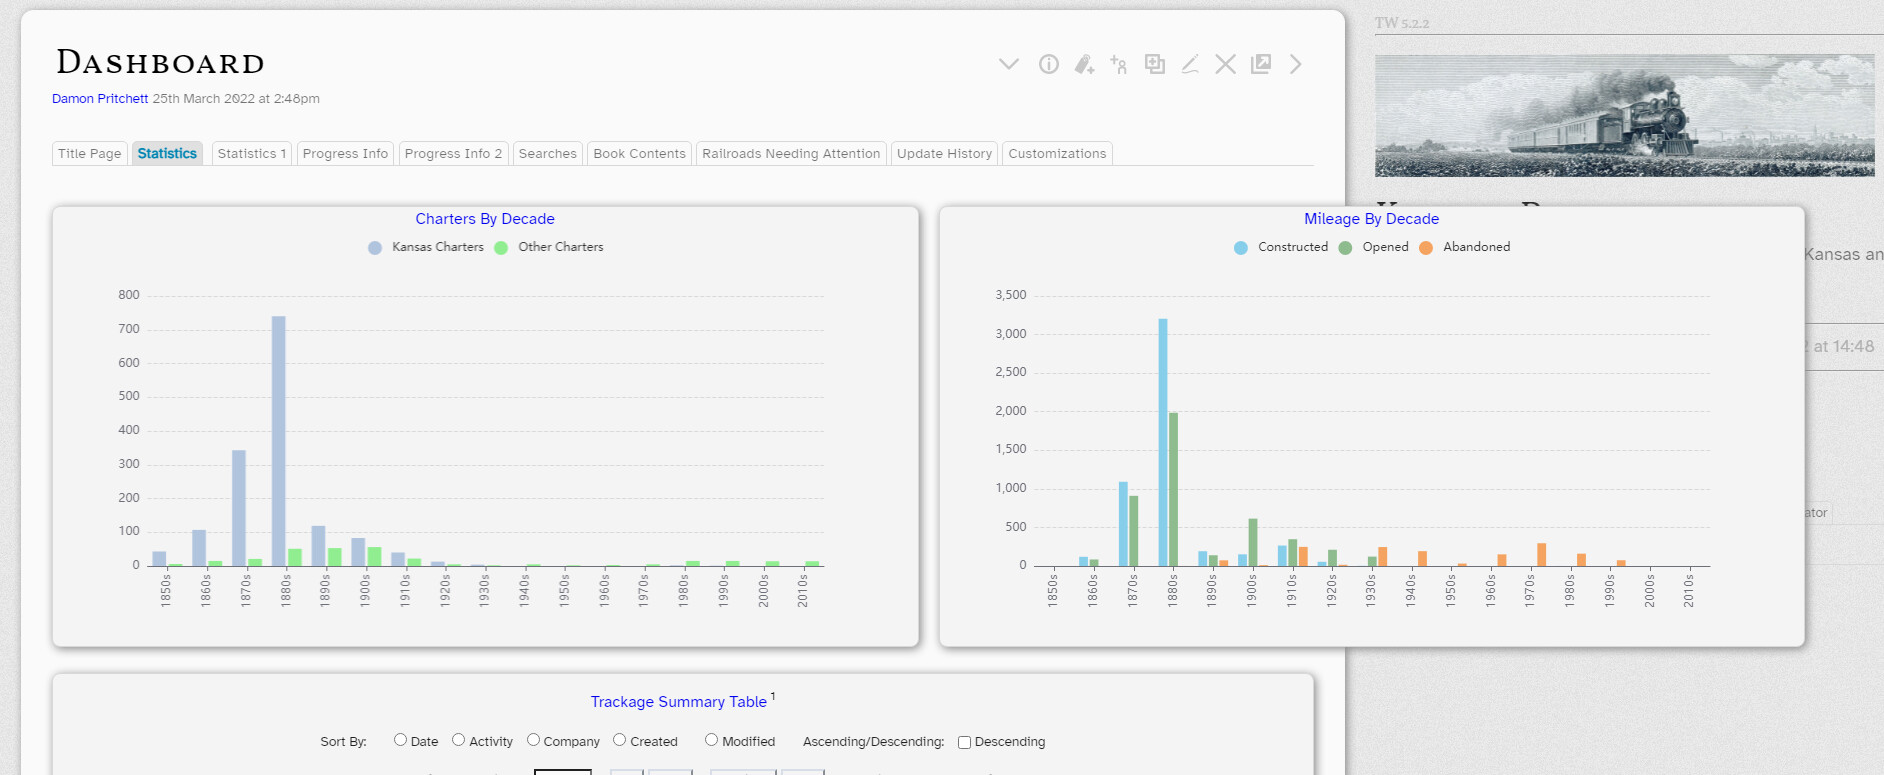
I’ve noticed a behavior with vertical bar charts recently that is a little annoying. I’ve generated a couple of vertical bar charts for some statistics in my TW (screenshot below).
Navigating to another tiddler and then back again fixes the issue. If I fix the width of the charts, this still happens if I make the browser window smaller.
Is this a bug in Echarts or is it a setting that isn’t be set correctly or at all?
I think there is a gap in the CSS somewhere such that what is 100% is confused depending on how it is rendered. Perhaps you just need to wrap the two charts in a div with a “width: 100%;” to keep it inside the tiddler, or it could be some overflow settings. I am no expert but I would look there first.
Remember the guidance not to use !important so it could be the cause of the problem or you could cause new problems if you use it.
Thanks. They are already wrapped by a div with width of 100%. Each chart has its own div and the three divs are setup using grid. Maybe it has something to do with grid.
I don’t have any overflow settings set so maybe it’s there somewhere. I rarely use !important and it’s not used here.
A little experiment is to put an EditTextWidget in some other tiddler to remotely manipulate the tiddler holding the graphs, just to see if any modification (e.g inserting some character in some not importan place) triggers refresh of the css and restores the desired sizes. That would be an indication that the css is not refreshed properly from when opening the sidebar. Not sure exactly what to do about it in that case but it is a start. Maybe.
I don’t know if you are using my plugin. If so, this may be caused by a browser compatibility issue. I was using the ResizeObserver object to listen for changes in div width to further change the size of the echarts, but older browsers don’t support the ResizeObserver object, which may be the reason.
If you are using the Gk0Wk/echarta plugin, try opening it with another recent browser (like Chrome) and see if you have the same problem.
@Sttot , there are some points (related to this issue) that I don’t fully understand in echart:
The ResizeObserver has the container (the div with id which starts with echarts-) as target. Wouldn’t it be better if the target is the parent node of the container?
Dynamic inline styles for width and height in all created elements by the widget. For example, the default width of block elements is 100% content area of its parent, and its height is determinated by the sum of the height of its children (in the normal flow) and their margins. Maybe you can set in inline styles: max-width in the container and a min-height or height in the canvas; and having a stylesheet with default values an properties for elements, for example for canvas set width 100% and height with the defaul value (300px)