There is an example of using filter in the documentation
3 Likes
Perfect! Thanks. I hadn’t looked that deeply yet. Very helpful.
1 Like
Have had a lot of fun the last couple of days playing around with Echarts. Here’s a screenshot of one of my charts using filters in the data file:
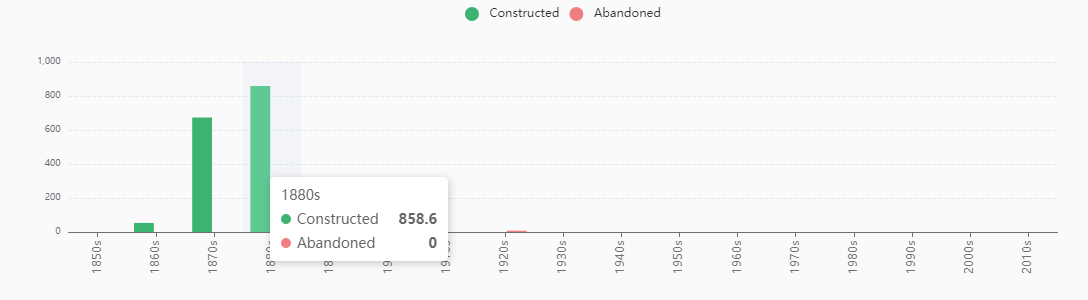
Not very exciting yet because I haven’t entered a lot of data, but it’s just what I was looking for!
Loving this plugin so far!
2 Likes
@nav @Mohammad @HistoryBuff @arunnbabu81 Version v0.0.4 adds a newbie-friendly way of using.
For example, if we want to use the graph here, then we put its code (note: the contents of the Edit Code and not the contents of the Full Code) into the $text parameter.
<$echarts $text="""
option = {
... (Content is too long so omitted)
"""/>
Or you can store it in a tiddler, such as [[ExampleOfTextData]], and take its value by transclude:
<$echarts $text={{ExampleOfTextData}}/>
I have also prepared the macro form, so the following is also possible:
<<echarts """
option = ...
""">>
macro also has optional parameters such as width, so we won’t go into them here.
<<echarts "$:/plugins/Gk0Wk/echarts/addons/SimpleExample.json">>
Details: ECharts — Awesome Visualization Library for TiddlyWiki5
5 Likes
Brilliant, thanks @Sttot !
This is wonderful! Thank you @Sttot !
Now I can directly use the Echarts examples from Examples - Apache ECharts in Tiddlywiki!
Looking forewords for more improvement!
This is my new example using v0.04
To give a try
- download graph-dynamic.json (1.2 KB)
- and drag and drop into ECharts — Awesome Visualization Library for TiddlyWiki5
-open exmp06/demo
1 Like
Hi fans of visualisation.
Did you find a template that can be used as a timeline to display historic events in the templates?
By the way I stumbled upon another echarts-site that might be of interest (perhaps not as much for TW as for other usage):The ECharts Online Builder
4 Likes
Just tried the simpler option with the $text feature. I love it! No need to worry about the double quotes. The next thing to try is to see if it works with filters.
So after playing around for a few hours, I have not been able to get filters to work with the $text option. I’ve also noticed that that using code copied from the Apache ECharts website works fine with the $text option, it does not work with the $tiddler option. The $tiddler option requires the ` mark around the whole text block and double quotes around each word and value. Also, the option keyword needs to be removed for the $tiddler option to work. In addition, the code does not behave the same between the $text and $tiddler options.
I know the above is probably not very helpful. I need to have examples given with code and screenshots, but I’m out of time for the day. Stay tuned.
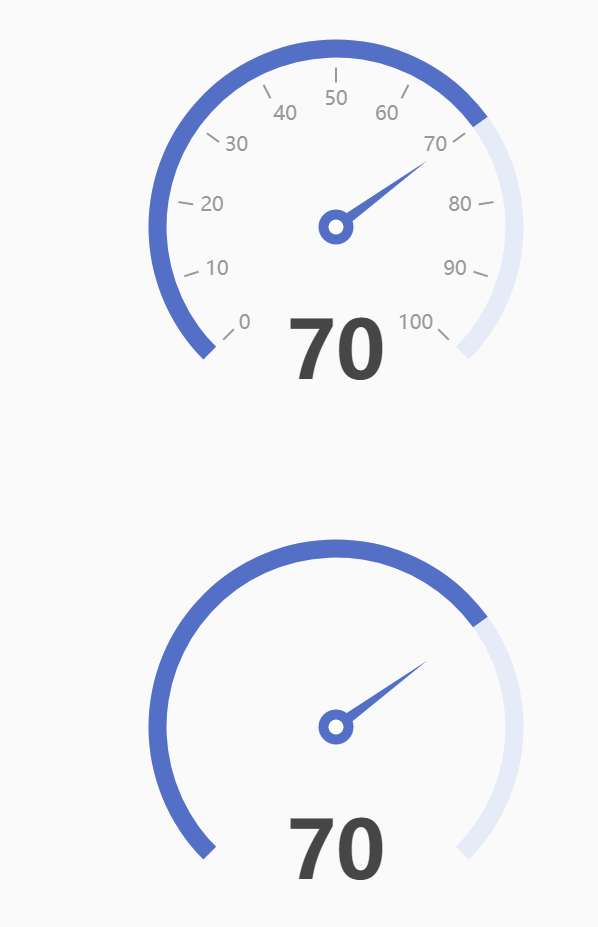
Ok - here’s some more information. See screenshot below. The code is from Examples - Apache ECharts.
The top gauge is using the new $text input method. The bottom gauge is using the $tiddler input method (code below). Note that this input method requires tick marks (backwards single quote) around the whole thing which are not included here.
Definitely a difference in behavior. As far as I can tell, the $tiddler input method is required to use filters (correct me if I’m wrong), which may make it difficult to get the chart that you’re really looking for if you’re wanting to use filters and lists. I’ve also noticed that the vars widget does not seem to work with this.
{
“series”: [
{
“type”: “gauge”,
“progress”: {
“show”: “true”,
“width”: “18”
},
“axisLine”: {
“lineStyle”: {
“width”: “18”
}
},
“axisTick”: {
“show”: “false”
},
“splitLine”: {
“length”: “15”,
“lineStyle”: {
“width”: “2”,
“color”: “#999”
}
},
“axisLabel”: {
“distance”: “25”,
“color”: “#999”,
“fontSize”: “20”
},
“anchor”: {
“show”: “true”,
“showAbove”: “true”,
“size”: “25”,
“itemStyle”: {
“borderWidth”: “10”
}
},
“title”: {
“show”: “false”
},
“detail”: {
“valueAnimation”: “true”,
“fontSize”: “80”,
“offsetCenter”: [“0”, “70%”]
},
“data”: [
{
“value”: “70”
}
]
}
]
}
I just started trying echarts. Using the example json above, what would a filter look like to get the value (currently it is static with a value of 70), from a field from the current tiddler–the current tiddler being the tiddler that is using the echart widget? Thank you.
what about transclusion in filter like `[[{{!!someField}}]]
@linonetwo
This is not working for me.
The following works, when I explicitly select a tiddler and a field…
"value": `{{mytiddler!!score}}`,
But I’m unable to get current tiddler to work. Your example and my example (below), do not work for me…
"value": `{{!!score}}`,
The code below works for me. Note the tick marks around the whole thing and the text widget. It’s specific to my use case and slightly different than what you’re trying to do. I hope this helps.
`{
  "series": [
    {
      "type": "gauge",
      "progress": {
        "show": "true",
        "width": "5",
        "roundCap": "true"
      },
      "axisLine": {
        "roundCap": "true"
      },
      "detail": {
        "fontSize": "16",
        "formatter": "{value}%",
        "offsetCenter": ["0", "75%"]
      },
      "pointer": {
        "offsetCenter": ["0", "10%"],
        "width": "3",
        "length": "120%",
        "itemStyle": {
          "color": "#000"
        }
      },
      "data": [
        {
          "value": `<$text text={{{ [tag[Railroads]summaryinfo[yes]count[]divide[1825]multiply[100]fixed[2]] }}}/>`,
          "name": "Summary"
        }
      ]
    }
  ]
}`
@HistoryBuff Thank you for the example. However, this does not help reference the “current tiddler”. echarts seems to work very well, except for when I want to reference the current tiddler.
@HistoryBuff @clsturgeon
v0.0.7 supports defining variables for those tw5 addon tiddlers, like this:
<$echarts $tiddler="xxx" outterTiddler=<<currentTiddler>>/>
then
`{
	"value": "`<$text text=<<outterTiddler>>/>`"
}`
2 Likes
@Sttot Thank you. This worked as expected. This now opens a number of possibilities.
I was using this echart in my budget wiki
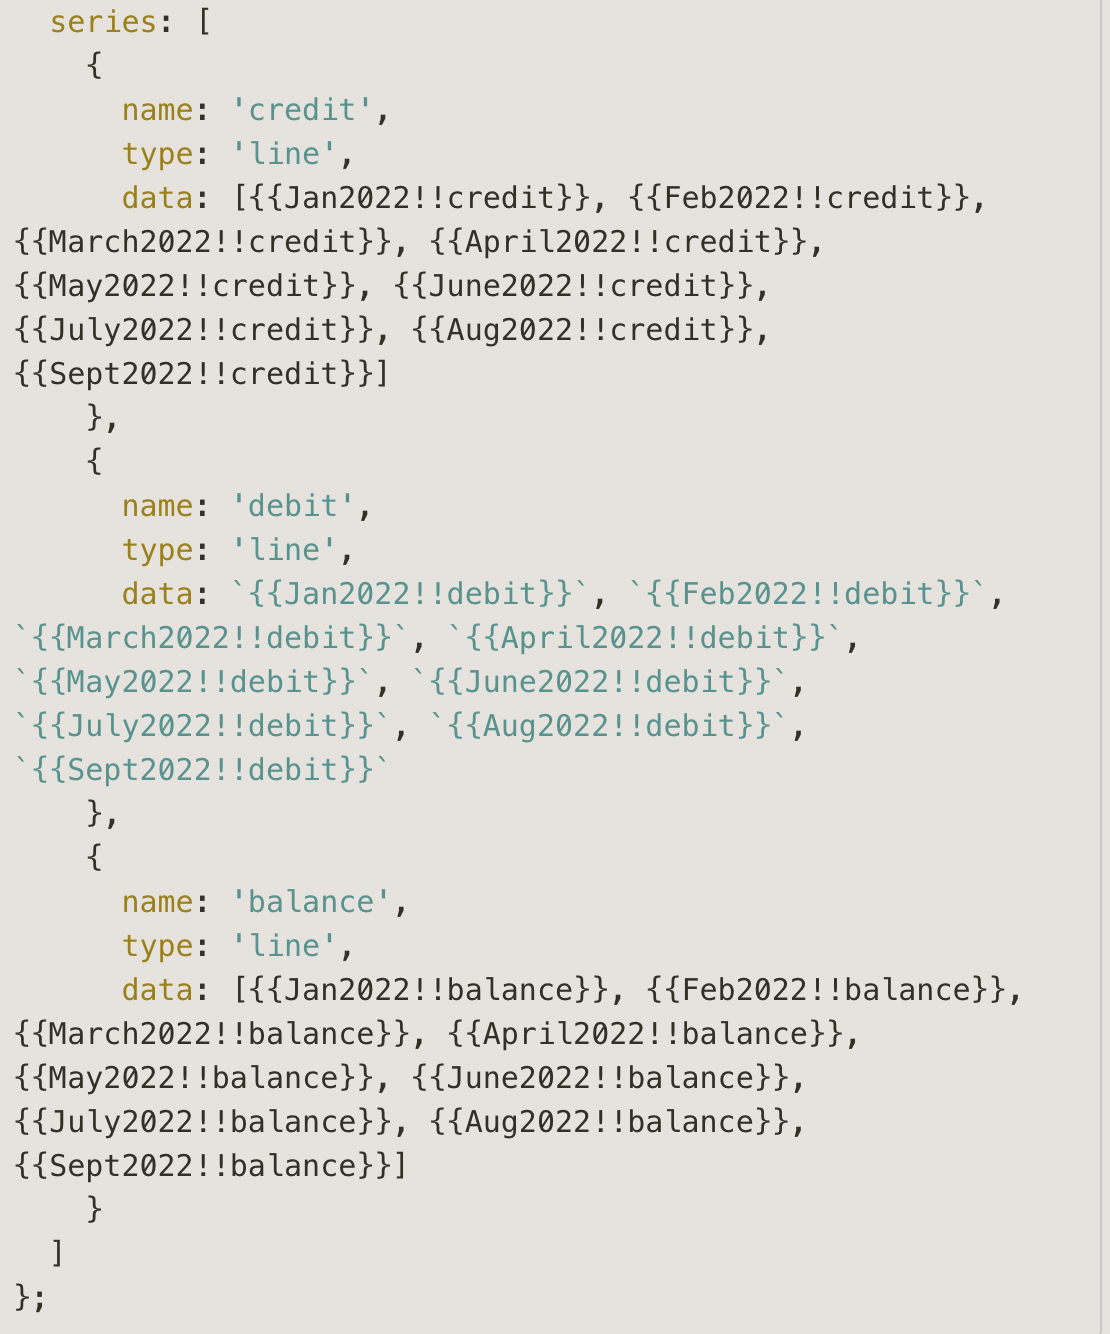
In the x axis, I have added months like 'Jan2022', 'Feb2022', 'March2022', 'April2022', 'May2022', 'June2022', 'July2022', 'Aug2022', 'Sept2022'. These are actual tiddlers in my wiki
In the y-axis, I want to retrieve the values from the credit, debit and balance fields of the above mentioned tiddlers like 'Jan2022', 'Feb2022', 'March2022', 'April2022', 'May2022', 'June2022', 'July2022', 'Aug2022', 'Sept2022' automatically, instead of manually entering it every month.
Is it possible?
I have created demo tiddlers in this wiki as shown below - one showing the orginal code and one showing the modification I added to dynamically retrieve the field values
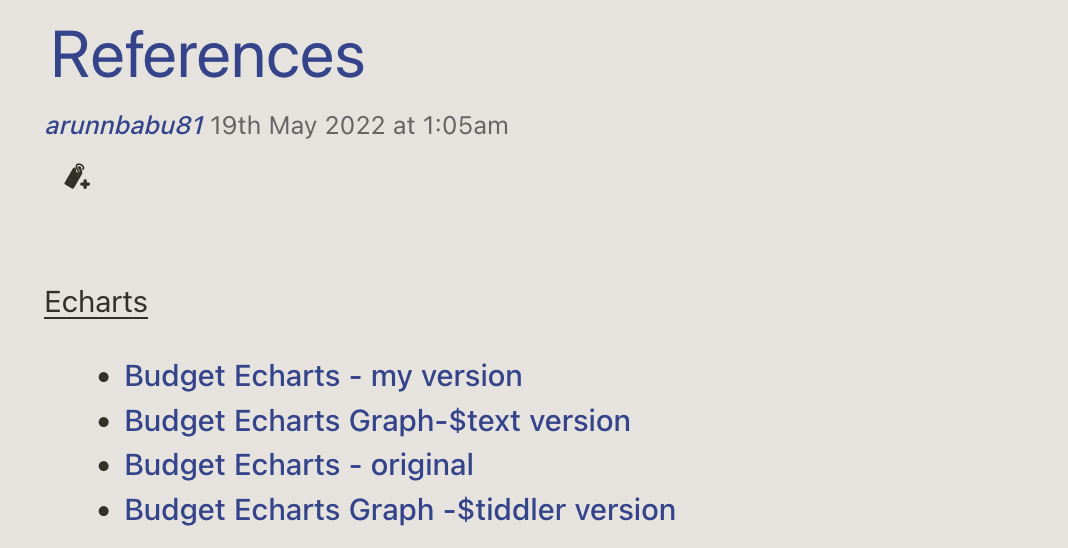
I don’t know what to enter in data fields of the tiddler Budget Echarts - my version. What I have done here must be wrong.
Also I dont know how to use the $tiddler version
Has anyone done anything similar which can be shared?
@Sttot @clsturgeon
It is not clear how to implement this, do you have an example to share?
Thxs!