So. I’ve gathered up and collected a few new plugins from various sources. Unforunately something has broke and now when i try to delete a tiddler I get the dreaded Internal JavaScript Error. The error is actually “Uncaught TypeError: Cannot read properties of undefined (reading ‘id’)”.
How best to debug issues like this? I have a backup and normally what I do is revert back to the previous version, apply each plugin individually and keep applying until one of them breaks something THEN i normally just don’t use that plugin…BUT a) I am probably missing out on something that is really very good b) This is a poor way to debug and fix a problem. c) I don’t much like resolving the problem this way…
I don’t know very much JavaScript but I am happy to dig under the skin to fix these kind of things if someone can prehaps point me in the right direction.
Much appreciated
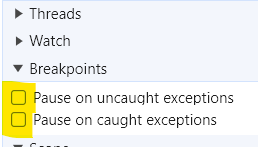
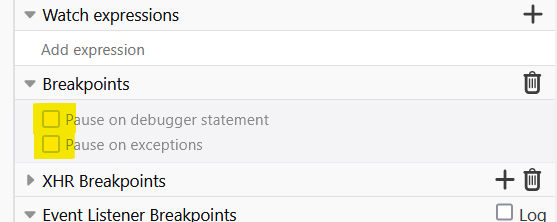
As a first step, open the DevTools debugger and check (turn on) these:
Chromium
Firefox
Keep DevTools open and repeat the steps to cause the error. You should close to the point where the exception occurred. Try to “walk back” on the stack and set a breakpoint earlier in the chain of calls. Now repeat the error steps again. You may eventually find the cause of the issue.
Good luck.
Thanks @CodaCoder.
Noob web developer question…Do I have to install the FireFox “Web Developer” browser add-on?
I was vainly trying to debug in TiddlyDesktop and I didn’t think of dropping back to the browser but I can see where you are pointing me…
Thanks
Installed the add-on…working on the problem…thanks
1 Like
Thank you @CodaCoder…I have managed to find and isolate the offending plugin. I will do some testing to try to work out what is going on and if I can get it to work. If not i’ll go forward without this plugin but I will send a email to the plugin author / owner.
I will sleep well tonight and I will be better armed for my future battles.
Thanks again
Usually you can see the plugin name in the error log in the browser console. In developer tool on context menu.
I did and I could. I forgot all about the built in (and add on) developer tools. I was looking at it purely through TiddlyDesktop and forgetting that it is brower based. Thanks

