Ste_W
January 26, 2024, 11:15am
1
Hello fellow Tiddlywikians.
I’ve been using the demo:graph-tw5 plugin (and on git )for a few years now. The one thing it is missing is legends from each axis.
I think it’s just a case of adding a CSS class and adding it to to the plugin json, but it’s sort of beyond me.
Would any TW/ CSS geniuses take a look? I could chuck a few cups of coffee your way
I think the files needing tweaking are graph-tw/widget.js and graph-tw5/graph.js
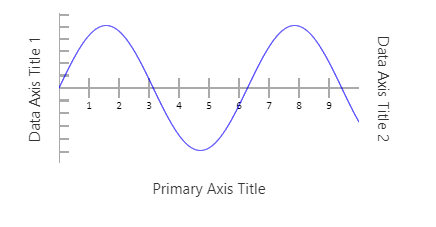
I would probably just be content with wrapping some HTML around the widget that creates the legends rather than trying to modify the plugin. You could then package this up as a macro or a custom widget.
Here is an example, borrowing from Axes | Charts.css
HTML/Wikitext:
<div class="ste-chart">
<$graph color='blue' thickness='1' minX="0" minY="-6" maxY="6" equation="
5 * Math.sin(x)
    ">
</$graph>
  <div class="primary-axis"> Primary Axis Title </div>

  <div class="data-axis-1"> Data Axis Title 1 </div>

  <div class="data-axis-2"> Data Axis Title 2 </div>
</div>
CSS:
.ste-chart {
	display: grid;
	align-items: center;
	justify-items: center;
	grid-template-columns: 50px 2fr 50px;
	grid-template-rows: 150px 50px;
	grid-template-areas:
		"data-axis-1 chart data-axis-2"
		". primary-axis .";
	width: 400px;
	height: 200px;
}

.ste-chart .column {
	grid-area: chart;
}

.ste-chart .primary-axis {
	grid-area: primary-axis;
}

.ste-chart .data-axis-1 {
	grid-area: data-axis-1;
	writing-mode: tb-rl;
	transform: rotateZ(180deg);
}

.ste-chart .data-axis-2 {
	grid-area: data-axis-2;
	writing-mode: tb-rl;
	transform: rotateZ(360deg);
}
Screenshot of the output:
You might need to tweak the CSS a bit to get the positioning of the legends to your liking if you use different sizes for the charts.
Below is a tweaked version as a custom widget for TW v5.3.0+ that also adapts the CSS for the different size parameters of the widget. The custom widget is used exactly as the original but with an extra labels attribute:
HTML/Wikitext:
\widget $graph(labels, width, height)
<$parameters $params="@params" >
<div class="ste-chart" style=`--width:$(width)$px; --height:$(height)$px`>
<$genesis
  $remappable="no"
  $type="$graph"
  $names="[<@params>jsonindexes[]]"
  $values="[<@params>jsonindexes[]] :map[<@params>jsonget<currentTiddler>]">
<$slot $name="ts-raw"/>
</$genesis>
  <div class="primary-axis"> <$text text={{{ [<labels>enlist-input[]] }}}/>  </div>
  <div class="data-axis-1"> <$text text={{{ [<labels>enlist-input[]nth[2]] }}}/> </div>
  <div class="data-axis-2"> <$text text={{{ [<labels>enlist-input[]nth[3]] }}}/> </div>
</div>
</$parameters>
\end

<$graph labels="Label1 Label2 Label3" color='blue' thickness='1' minX="0" minY="-6" maxY="6" width="600" height="400" equation="
5 * Math.sin(x)
    "/>
CSS:
.ste-chart {
	width: var(--width);
	height: var(--height);
	display: grid;
	align-items: center;
	justify-items: center;
	grid-template-columns: 50px 2fr 50px;
	grid-template-rows: calc(var(--height) - 50px) 50px;
	grid-template-areas:
		"data-axis-1 chart data-axis-2"
		". primary-axis .";
}

.ste-chart .column {
	grid-area: chart;
}

.ste-chart .primary-axis {
	grid-area: primary-axis;
}

.ste-chart .data-axis-1 {
	grid-area: data-axis-1;
	writing-mode: tb-rl;
	transform: rotateZ(180deg);
}

.ste-chart .data-axis-2 {
	grid-area: data-axis-2;
	writing-mode: tb-rl;
	transform: rotateZ(360deg);
}
Ste_W
January 26, 2024, 4:01pm
4
That looks really good. It will have to wait till Monday morning now but thanks!
Ste_W
January 29, 2024, 6:36pm
5
Works beautifully as advertised. Thanks once more.
 (or the TW pot)