Building an SVG graph from fields

I’m trying to build an SVG graph from points in a specific tiddler but I’m struggling to figure out how to do that. For purposes of this question, assume I have a tiddler called Texas with fields date1 score1 date2 score2 date3 score3, etc. I need to build a line that looks something like

<polyline points="date1,score1 date2,score2 date3,score3 date4,score4" style="fill:none;stroke:green;stroke-width:3" />

where the dates and the scores come from the same tiddler. The rest would be standard boilerplate.

Can one of you point me in the right direction?

Not sure this answers the question. I use a googlechart macro from here:

http://www.scss.com.au/family/andrew/tiddlywiki/#Google%20Charts

to do this:

https://clsturgeon.github.io/MemoryKeeper/AlexanderGrahamBell/AlexanderGrahamBell.html#Population%20Data%20-%20Boston

I wrote this template to graph tiddlers tagged with “data”, hence why the graph appears.

https://clsturgeon.github.io/MemoryKeeper/AlexanderGrahamBell/AlexanderGrahamBell.html#%24%3A%2Fplugins%2Fcls%2Fmk%2Ftemplate%2Fdata

Is this what you meant?

Craig

I have written a plugin that changes an SVG button icon and an SVG bar graph.

I would suggest if possible having most of the SVG code as image tiddler and then altering only the fields you need to change. A tiddlywiki SVG image file gets parsed and so any macro substitutions are made during parsing which is how field values end up in the SVG code.

I am on my way out right now - the best I can do in the time available is point you towards the plugin, it’s only a few files. Look for the plugin json file I added there 10th Apr - look for it in the following thread

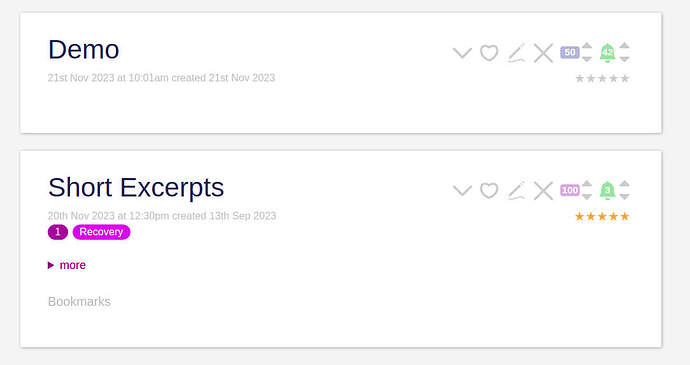
The rate tiddlers plugin shows a rectangular button in each tiddler toolbar with a rating value [1 100] and changes colour as the rating is changed. To see it in effect load the plugin into an empty tiddlywiki - create a new tiddler and observe the grey (inactive) rectangular button on the tiddler toolbar - click on it to activate, it should show a rating of 50 which you can change with the up down arrows. Ignore the Green bell in the following picture, its the coloured rectangular buttons with 50 and 100 rating that we are interested in.

If you find the tiddler in the plugin for the button and look at the SVG code you will see how the rating value from the tiddler field “rating3” is inserted into the SVG.

If you want a more direct “How to” then I can return to this later - if you want to plunge in then this plugin might make a good sandbox for testing your needs out.

The plugin also manages an SVG bar graph ( second sidebar tab for the rating plugin ) which might be most relevant for you - you would need a few tiddlers with ratings to see this work properly but that should take only a few clicks -the bar graph changes dynamically as you change the ratings on different tiddlers.

The syntax for getting the field value injection into the SVG in a way that could be parsed by tiddlywiki was a bit fiddly so starting from this might save you time.

BTW - the Journal icon in a standard Tiddlywiki which shows the correct day of the month as an integer uses this principle.

1 Like

As discussed in Idea: approach to palettes and themes - #7 by Scott_Sauyet, I built some reasonably sophisticated thumbnail-style SVG’s using this:

Thumbnail.json (4.3 KB)

The end of that tiddler just embeds some TW icons in these thumbnails. The top is where the dynamic stuff is happening, including bits like this:

  <rect x="0" y="0" rx="50" ry="50" width="1220" height="674"
    style=`fill: ${ [{!!pal}getindex[page-background]]}$; stroke-width: 1; stroke:${ [<pal>getindex[tiddler-border]]}$;`

where pal is a field holding the names of one of the palettes in the wiki.

and more sophisticated bits like this that makes a line of rectangles meant to approximate text:

\procedure line-text(x, y, height, width, text, color)
  <$list filter="[<text>split[]]" counter="cnt" variable="letter"><$list filter="[<letter>!match[ ]first[]]" variable="_">
 <rect 
    x={{{ [<cnt>multiply[3.5]multiply<width>add<x>subtract<width>] }}} 
    y={{{ [<letter>is.capital[]match[yes]then[0]else[.33]] +[multiply<height>] +[add<y>] }}} 
    width=<<width>> 
    height={{{ [<letter>is.capital[]match[yes]then[1]else[.67]] +[multiply<height>] }}}
    style=`fill:  ${ [{!!pal}getindex<color>]}$; stroke-width: 1; stroke:${ [{!!pal}getindex<color>]}$;`
  />
 </$list>
\end

Some day, I might like to get back to that. But the ideas in there may help you.

1 Like

@Stephen_Kimmel I edited your post to make your code example appear correctly. You can edit it yourself to see what I did.

1 Like

Thanks for the input. Obviously you’ve done a lot of work on creating curves in a wiki, It appears that you settled on using Google as your main goto for graphs. If you had to work periodically offline, what would you use instead.

And, for what it is worth, that is a very nice looking wiki you have there. My personal preference is for a darker theme and if I could change the penguin color scheme to something more to my liking I might add it to my usual forms.

Thanks to everyone who offered comments on the graphing portion of my problem. The graphing is not a particularly easy part if you want something dynamic but you’ve given me a good start in that direction.

My current stumbling block is how to extract an indeterminant number of fields from a single tiddler and concatenate them into a single string that I can then insert into another tiddler to form my svg polyline.

This may not be directly on-point (and I don’t have time to play with a line-chart variant right now) but I want to at least mention the possibility that sometimes css is a fine tool for graphic display of information. For example, everything in this complex pie chart draws on tiddler field values to assemble a dynamic css view: Quick demo — showcasing…

Let us know how it goes!

Actually, no I have not done lot work. But, yeah I guess I did settle on Google Charts. I have also used its timelines for Periods and Organizations. The devices in use for this are typically online. I use other plugins that require the Internet; such as TiddlyMaps. I have a tablet where if I’m out and about with it, it will not have Internet access (unless I tether it to my phone). In those rare cases I’m offline, I go without those features.

I’m not very familiar with svg usage, but the actual data extraction shouldn’t be too difficult, assuming that you have either

  1. a list of fields that should be included, if present
  2. a list of fields that should never be included, and any other fields that are present will be included, or
  3. a predetermined named scheme that all relevant fields will use.

I’m happy to help construct the relevant filters if you can provide a little more detail about what your fields look like and what your expected output looks like. In general, I’d try something along these lines:

CASE #1 (included fields)
\define included() field1 field2 field3 field4

[<currentTiddler>fields:include<included>] :map[<..currentTiddler>get{!!title}addprefix[,]addprefix{!!title}] +[join[ ]]

----

CASE #2 (excluded fields)
\define excluded() draft.title draft.of title caption tags text type created creator modified modifier

[<currentTiddler>fields:exclude<excluded>] :map[<..currentTiddler>get{!!title}addprefix[,]addprefix{!!title}] +[join[ ]]

-----

CASE #3 (prefixed fields - here I'm assuming all relevant fields have the prefix "date")

[<currentTiddler>fields[]prefix[date]] :map[<..currentTiddler>get{!!title}addprefix[,]addprefix{!!title}] +[join[ ]]

You can define a variable by using a filtered transclusion in a $let widget or by defining a function at the top of the relevant tiddler:

\function mv-data() [...your filter goes here...]

OR

<$let my-data={{{ [...your filter goes here...] }}}>

<some-element attribute=<<my-data>> />

</$let>

Note: My original approach was broken.

Broken original approach
\procedure get-point(idx) 
<$let 
    x={{{ [<idx>addprefix[data]] }}} 
    y={{{ [<idx>addprefix[score]] }}} 
 ><$text text={{{ [get<x>] [get<y>] +[join[,]]}}} /></$let>
\end

<$list 
    filter="[<currentTiddler>fields[]prefix[data]removeprefix[data]]" 
    variable="idx"
     join=","
><$transclude 
    $variable="get-point"
    idx=<<idx>>
/></$list>

In a tiddler with these fields:

data1: 125
data2: 138
data3: 146
data4: 161
score1: 5864
score2: 6127
score3: 6430
score4: 7396

It gives this result:

125,5864,138,6127,146,6430,161,7396

My Graph.json (605 Bytes)

It does depend on your fields being well-structured, with dataN and scoreN always coming in pairs. It also works only on the data in the current tiddler. If you wanted to fetch the data from a different one, it would need some work.

Here’s a fixed version:

\procedure get-points(tid)
\whitespace trim

\procedure get-point(idx, tid) 
<$let 
    x={{{ [<idx>addprefix[data]] }}} 
    y={{{ [<idx>addprefix[score]] }}} 
><$text text={{{ [<tid>get<x>] [<tid>get<y>] +[join[,]]}}} /></$let>
\end get-point

<$list 
    filter="[<tid>fields[]prefix[data]removeprefix[data]]" 
    variable="idx"
    join=","
><$transclude 
    $variable="get-point"
    tid=<<tid>>
    idx=<<idx>>
/></$list>
\end get-points

We call it like this, using the points from the tiddler “My Graph”:

<<get-points "My Graph">>

If “My Graph” has these fields:

data1: 125
data2: 138
data3: 146
data4: 161
score1: 5864
score2: 6127
score3: 6430
score4: 7396

It gives this result:

125,5864,138,6127,146,6430,161,7396

My Graph.json (735 Bytes)

This depends on your fields being well-structured, with dataN and scoreN always coming in pairs.

I would love to hear of simplifications. I feel as though there should be some approach that does the extraction in a single filter, but I haven’t figured out how.
I see someone has already linked to my site (Andrew's TiddlyWiki — Plugins and Macros) and the GoogleCharts plugin. For offline support I’ve got a lot more charting options. The smallest would be Chartist, and it supports line charts.

If you add the Chartist plugin from my wiki to your wiki, then add a tiddler with the fields:

data: 1,6,3,2
labels: a,b,c,d

And the following body text:

<$chartist type=line width=300px>{
"data":{
"labels":[ <$text text={{{[all[current]get[labels]split[,]addprefix["]addsuffix["]join[,]]}}}/>
],
"series":[[ {{!!data}}
]]
},
"options":{
  "lineSmooth":{"fn":"none"}
}
}</$chartist>

That will produce a line chart (everything all in the one tiddler).

Alternatively, if you created a dictionary tiddler called “TestData” with:

a:1
b:6
c:3
d:2

Then the following in a second tiddler would produce a line chart of that:

<$chartist type=line width=300px height=300px>[
<<ChartistDictionarySimple "TestData">>
]</$chartist>

Hope this helps.

I will look into Chartist. How close is it to being ready for prime time?

Scott. Thanks for the routine. It clearly works and at this point I’ve only made one minor variation to it.

Where it says

<$list 
    filter="[<tid>fields[]prefix[data]removeprefix[data]]" 
    variable="idx"
    join=","
>

I changed

join="," to join=&nbsp;

I tried simply changing the comma to an ordinary space but for reasons I don’t understand, that didn’t work.

Which raises a bigger issue for me. There is no denying that your routine works, but I don’t understand why it works. Could you point me to something in the main Tiddlywiki or perhaps Grok Tiddlywiki that will help me understand what is happening in your routine?

The reason I’ve marked it “proof of concept” is that I don’t use it myself (I’m mostly using Chart.js now), so I haven’t put in a lot of effort testing functionality. It would seem to me quite OK for simple line/bar/pie charts.

Oops, that was based on a too-quick read of the original. I didn’t notice that the points were space-separated. I also don’t know why join=" " doesn’t work. But rather than using a non-breaking space (I have no idea if that would work in an SVG, but even if it does, it feels strange) I would choose a different workaround:

\procedure space() <$text text=" " />
<!--  ...  -->
     join=<<space>>

(My Graph 2.json (790 Bytes))

This seems slightly simpler than my first alternative, which was

\procedure space() {{{ [charcode[32]] }}}

but I think either would work fine.

Ok, let’s take it apart. I don’t know your level of expertise, so this likely covers stuff you already understand. Sorry.

  • \procedure space() <$text text=" " />
    

    Procedures are named snippets of text, sometimes parameterized. We will call this later with the shortcut <<space>>. Here our content is simply a TextWidget which yields a single space.

  • \procedure get-points(tid)
    

    We begin another new procedure named get-points. This will last almost through the end of the file, until the line

    \end get-points
    

    Note that this procedure accepts a parameter tid, my usual shorthand for tiddler. Because we can nest procedures its a useful habit to add the name to the \end nodes. I probably should also be indenting the nested procedures, but didn’t do so this time.

  • \whitespace trim
    

    This allows us to write easily readable code, knowing that the whitespace between nodes doesn’t end up in the output.

  • \procedure get-point(idx, tid) 
    <!-- ... -->
    \end get-point
    

    This procedure is internal to get-points. It’s probably a bad idea to have two related bits with names differing only by the final “s”, but that’s how I wrote it, and only really noticed just now. Another version might choose get-points/get-single-point or get-all-points/get-point; but it’s too late now. The procedure accepts the parameters idx (my shorthand for index) and tid (again for tiddler.)

    This procedure has a TextWidget wrapped in a LetWidget. The LetWidget creates a scope in which a collection of variable definitions are active. Here we define two, x and y, for the coordinates of our point:

    <$let 
        x={{{ [<idx>addprefix[data]] }}} 
        y={{{ [<idx>addprefix[score]] }}} 
     >  <!-- Text Widget here --> </$let>
    

    We define them using Filtered Attribute Values, in which triple curly braces surround a Filter Expression, as in {{{ expression }}}, and returns the first result of the filter. Our x expression starts with a reference to the idx variable, and then adds the prefix “data”. For y, we use the prefix “score”. Thus, if idx has value 42, we will get the variables x = "data42", y = "score42".

    Inside this let context, we have this TextWidget:

    <$text text={{{ [<tid>get<x>] [<tid>get<y>] +[join[,]] }}} />
    

    Again we have a filtered attribute value, which contains three filter runs. The first one uses the tid variable to reference the supplied tiddler, and then calls the get operator, passing our x variable, which means, if x is data42, that we get the value of the field data42 from the given tiddler. Similarly, we get our y variable, which might be the value of the field score42. The third run uses the join operator to combine these two value with a comma. So if the field data42 in tiddler “My Graph” has value 867 and the field score42 there has value 5309, then <<get-point 42 "My Graph">> will yield, the string "867,5309".

  • Now we get to the main body of our get-points procedure. This has a TranscludeWidget wrapped in a ListWidget. The transclusion looks like this:

    <$transclude 
        $variable="get-point"
        tid=<<tid>>
        idx=<<idx>>
    />
    

    Below I’ll show a way to shorten this. For now we use the TranscludeWidget to include get-point, passing the current tid and idx values as parameters. This will include the comma-separated x and y values from the data for the given index. This is wrapped in a ListWidget with our most complex bit of code:

    <$list 
        filter="[<tid>fields[]prefix[data]removeprefix[data]nsort[]]" 
        variable="idx"
        join=<<space>>
    ><!-- ... transclusion here ... --></$list>
    

    Lists and filters are at the core of TW. Here we use the ListWidget, which takes all the values generated by a filter, and supplies them one at a time to what’s in its body – in this case our transclusion. We give the name idx to the variable holding the current iteration’s value, and we say that we will join them using the value supplied by <<space>> which, we recall, returns a single space character. The filter is how we select our indexes. It contains a single run, which performs the following steps:

    • <tid> returns the value of the variable tid. It’s expected to be the name of a tiddler, perhaps something like “My Graph”
    • fields[] collects the names of all the fields in that tiddler
    • prefix[data] filters that list of field names to those that begin with “data”
    • removeprefix[data] strips off the initial string "data" from each of those values, leaving only the trailing digits. (This makes it clear that we might need more sophistication if your fields could include other, irrelevant values that start with “data”. If you might also have “database”, “datary”, “datable” for field names, this filter will have to be improved. That might take a regular expression test in place of prefix[data].)
    • nsort[] sorts the values numerically. (I forgot this in my first version.) This could be important to prevent data10/score10 from appearing before data2/score2 as lexicographical sorting would do. I haven’t actually tested to see if it’s necessary.

    At the end of this filter, we have a list of integer values. Again, these are passed individually to get-point, and the results are joined with a space character.

  • We demonstrate a call of this procedure with

    <<get-points "My Graph">>
    

    This is a shortcut syntax for the TranscludeWidget. It works well with static inputs, such as “My Graph”, but may be more difficult or even impossible to use with dynamic values. You can always fall back to the long form of the TranscludeWidget.

Shortened Version

That last point about the shorthand transclude syntax brings us to a way we can shorten our code. Here’s a version that skips some of the parameter passing and uses implicit context for variables, allowing us to use the shorthand syntax for our main transclusion:

\procedure space() <$text text=" " />

\procedure get-points(tid)
\whitespace trim

\procedure get-point() <!-- Look, Ma, no parameters named! -->
<$let 
    x={{{ [<idx>addprefix[data]] }}} 
    y={{{ [<idx>addprefix[score]] }}} 
 ><$text text={{{ [<tid>get<x>] [<tid>get<y>] +[join[,]] }}} /></$let>
\end get-point

<$list 
    filter="[<tid>fields[]prefix[data]removeprefix[data]nsort[]]" 
    variable="idx"
     join=<<space>>
><<get-point>></$list>  <!-- *** Note: no complex <$transclude> call here *** -->

\end get-points

<<get-points "My Graph">>

(My Graph 3.json (716 Bytes))

Many TW users – likely a majority – would prefer this version with its shortened code. I won’t try to argue with them, but I prefer as much as possible to be explicit when using nested contexts by passing parameters around. So I would choose the previous one, myself. You can make your own call.

References

1 Like

A little late to the discussion and it’s not svg but would graphing plugin provide any usefulness?