Hello all, I am on a business analysis course where we have used affinity mapping/diagramming as a technique. I have found a lot of value in it and I’m interested in executing this within my wiki, and I’d like to ask for your advice on how it can be done.
Quoting from my course:
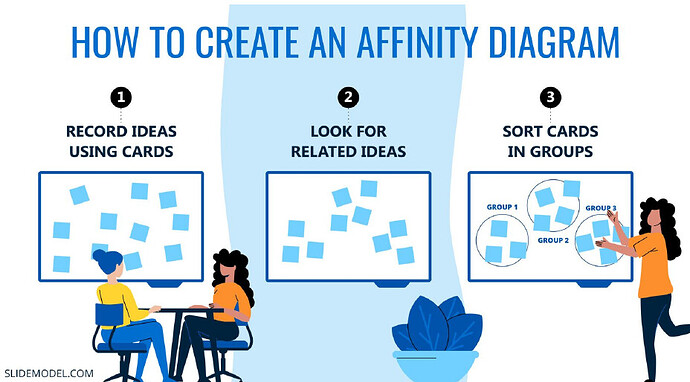
An affinity diagram is a collection of large amounts of data that is organised into groups or themes based on their relationships.
The technique is most useful for groups performing qualitative analysis. We are provided lots of evidence (data) of different types, and asked to put them together to draw insight. For example, we will have verbatim customer surveys, financial information and so on, and trying to put ideas together to resolve a customer issue.
We are doing this on sticky notes within MURAL, which is a Figma-esque shared whiteboard.
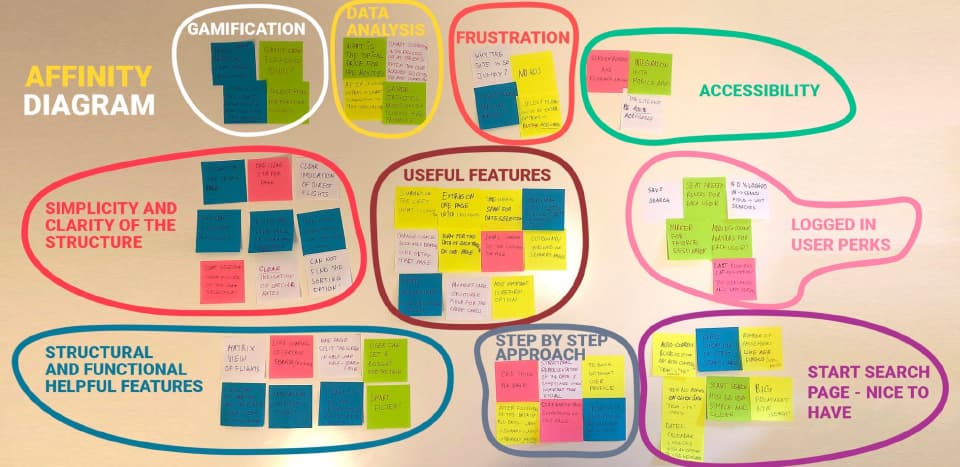
A picture says a thousand words:
Gives us something which looks like this…
I am wondering if I can apply this technique as an individual, within TiddlyWiki. Tiddlers seem like a natural format conceptually, the question is more for how to display them and make it easy to pull the thoughts together.
Two questions to get us started:
- Have you ever used this method?
- Are there any techniques you use similar to this method within your wiki?
If not, can you think of any tools which approximate this approach for reviewing & categorising related tiddlers?
Requirements from a software perspective:
- It must be easy to view all the tiddlers of the map at a glance, while doing the affinity mapping.
- It should be very easy to group them together with other tiddlers.


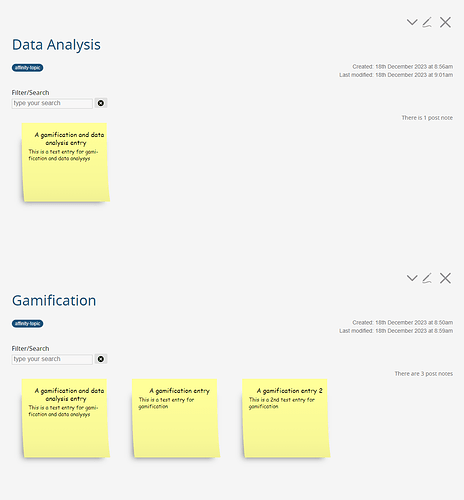
 about this mockup/model…
 From that point, I might be able to carve up the 2D space into proximity-neighborhoods that have some coherence (significantly better than random!), even without needing to find articulate labels for the neighborhoods/categories.