
Ooooh, I’m liking that!!
Very interesting story! Thank you for sharing Mark!
I am interested on 3D data presentation in TiddlyWiki and would be happy to share the findings later.
This is a 3D example of Journal with three set tabs.
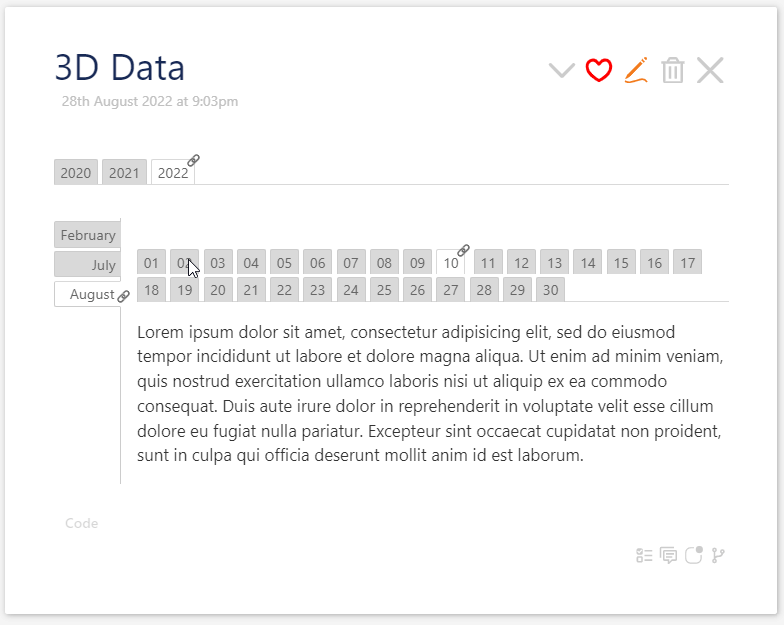
This solution uses tags field
4 Likes
Yes, please do share!
1 Like
Wow, that’s very creative and very functional!! Brilliant!!
I used the macro tabs, heatmap in echarts and diary to present the daily journal (although it doesn’t fully display as 3D data).
heatmap shows the number of daily activities, diary creates links to daily journal.
2 Likes
I will see if I can find it when off my mobile but I recall a plugin or macro call x-list which created tables from two or more organising parameters, thus 3d plus using parameters such as subject, category and type which each have 2+ values.
This was great for presenting a 3d index page.
I have been developing a similar approach.
- One tiddler for each colleague to store basic information with tag
ColleagueandCurrent Institute. - One tiddler for each research area with a tag
Domain - Literature is imported from Zotero into TW through refnotes which are tagged as
ColleaguesandDomains - Other tiddlers are tagged as
Colleaguesif I need to communicate with them.
In the Colleague page, I write a few macros to summarise
- Literature published by colleague
- Activities I have communicated with
I am trying to figure out how to display all research areas as I am not sure how to remove the duplicates from tiddler filter.
Have a look at the unique filter or try and restate your filter since deduplication is default.
1 Like
As I suspected xlist is a Tobias’smacro creations, one of his many tools that demonstrate the longevity of solution in tiddlywiki. I have not tested it recently but will soon.
His example uses topics/Publications
Warning I have being experiencing “awe snap” failures attempting to install xlist on newer wikis
1 Like
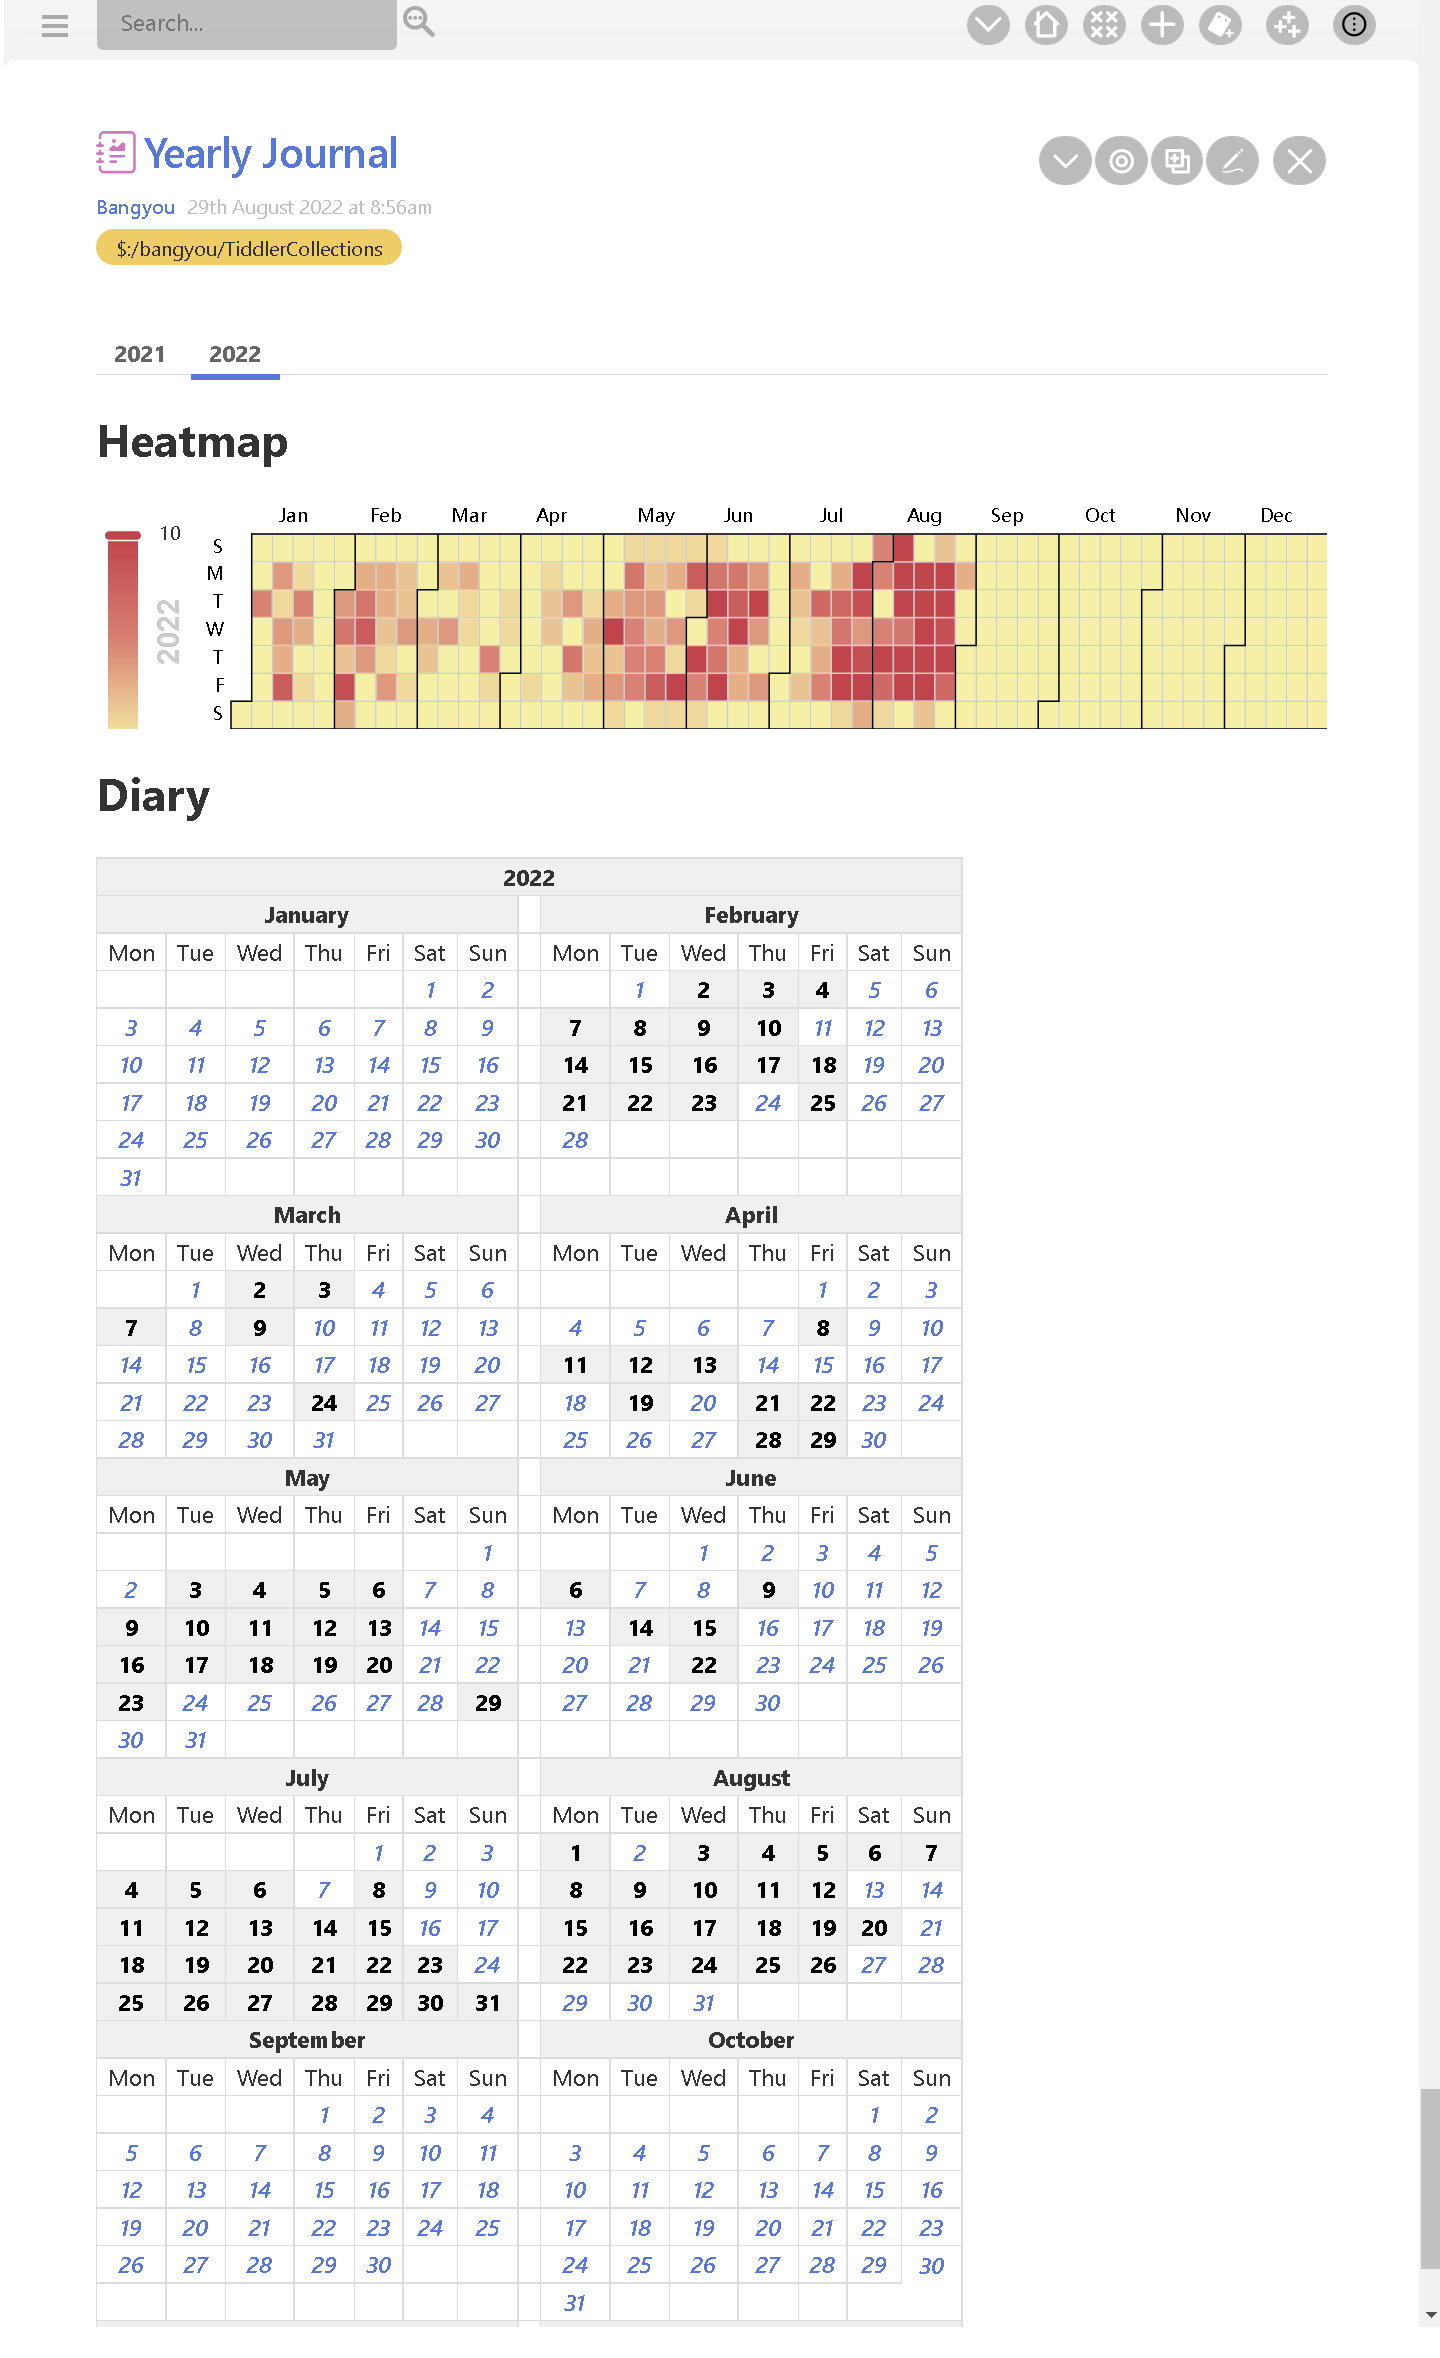
Nice solution: what is diary? Is it part of echart?
Hi @markkrieg
See the code/demo shared here: A Journal Book: Display Journal Tiddlers on a Monthly Basis - Tips & Tricks - Talk TW (tiddlywiki.org)
Slightly off topic but 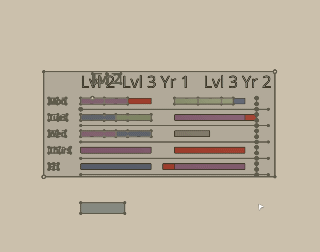
Here is a time table in three dimensions.
Created in Onshape.com. Each colour is a different staff member. Drawings can then be created for each course or staff member.
It’s a bit hammer and nut but…
3 Likes
A very intriguing idea! Thank you for sharing that link to your code! I would have to do a lot of modification of your macro for it to work properly with my tiddlers. Because I had previously journaled almost two decades in a single ASCII text file, I separated each entry with a standard formatted header line of…
YYYY.MM.DD - tag
I did this so I could easily import it into something down the road, and it certainly paid off when I discovered TiddlyWiki! Each of my journal entries were broken out by this header and tags were extracted at the same time. However, my creation dates of the Tiddlers are not at all accurate as a result. But if I can modify the macro to scan the tiddler’s Title field, this might work!
Thanks again!
1 Like
Another way to look at is the creation dates are accurate, its when the tiddlers were created. If you do convert the dates to a tiddlywiki date serial number I suggest instead set a journal-date field or something else. Why loose information when you do not need to?
Start another topic if you need help with the conversion.
This is very nice. May be using echart one can create such amazing 3D presentation 
1 Like
Very nice. Can you share the demo TW?
Hi Simon,
The code shared here