Help with count

Hi

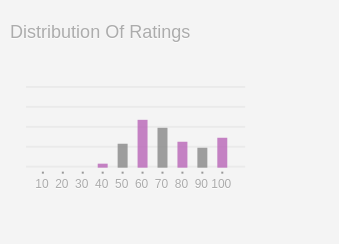
I am trying to create a bar-chart using an existing SVG graphic - the heights of the rectangles have a value set as an attribute but this is sucessfully over-riden by a style statement which then sets the height to parameter referenced from within the SVG file.

This is all working fine if I pass in hardcoded values, the macro drawGraph2 is working correctly with values b1 to b8 which I used in the previous stage of development, But now I am ready to start prototyping the next stage so for b9 and b10 the value is provided by the macros count80to90 and count90to100 - these use the count filter expression and that is where the problem starts.

<$list filter="[]">
<$let b1=30 b2=75 b3=40 b3=40 b4=40 b5=40 b6=29 b7=41 b8=46 b9=<<count80to90>> b10=<<count90to100>> >
<<drawGraph2>>
</$let>
</$list>

Here is an extract of my SVG


<rect x="40" y="0" width="5" height="66" style=`fill:#123; height:$(b7)$; opacity:50%`/>
<rect x="45" y="0" width="5" height="64" style=`fill:#627; height:$(b8)$; opacity:50%`/>
<rect x="50" y="0" width="5" height="60" style=`fill:#123; height:$(b9)$; opacity:50%`/>
<rect x="55" y="0" width="5" height="60" style=`fill:#627; height:$(b10)$; opacity:50%`/>
<text x="50" y="20"><<b9>><<b10>></text>

The substitutions for b7 b8 work just fine as these were set as variables to hard coded numbers see the first code segment so $(b8)$ is successfully parsed as 46 - all good there!

However b9 and b10 are inconsistent - they do get parsed into numbers as intended in the following debugging text statement which is temporarily added to the SVG

<text x="50" y="20" > <<b9>><<b10>></text>  

However b9 and b10 are not parsed correctly in the SVG code for the rectangles, the style statement for height is where the problem lies.

When I inspect the SVG I see that the style statement for the height of rectangles for b9 and b10 remains as a filter expessions from the macros count80to90 and count90to100 whereas what I wanted was the result of evaluating those macros - an integer but what I actually see is the count filter expression.

The following extract from the final rendered SVG contrasts the behaviour for b8 and b9, b8 with a height value of 46 appears correctly in the style statement but b9 which is intended to be the numeric value obtained from the macro count80to90 actually appears as the filter expression used in count80to90.

<rect x="45" y="0" width="5" height="64" style="fill:#627; height:46; opacity:50%"></rect>
<rect x="50" y="0" width="5" height="60" style="fill:#123; height:<$count filter=&quot;[all[tiddlers]!is[system]has:field[rating3]] :filter[get[rating3]compare:integer:gteq[80]] :filter[get[rating3]compare:integer:lt[90]]

My code is horribly inefficient at the moment, I am working my way to something reasonable but the nub of this is how do I ensure that the result of a macro is evaluated and fully resolved?

Ideally I want to pass fully resolved numbers to the macro that deals with the value substitutions in the SVG code.

Thanks

I know there are plugins to add graph features to tiddlywiki but I am writing a plugin and wish to keep dependencies on other plugins to a minimum - in principle the fact that tiddlywiki parses SVG code does lend itself to some simple SVG graphs simply modifying values in an existing SVG graphic.

IMO you could use the new parametrised transclusion feature, which is also used by the core icons.

eg: $:/core/icon

If you edit it, you can see size is a parameter with a default value.
In the SVG element the <<size>> variable can then be used.

\parameters (size:"22pt")
<svg width=<<size>> height=<<size>> viewBox="0 0 128 128"><path d="M64 ...

To call the icon with a new size you can use

  • {{$:/core/icon | 3em }} ā€“ or
  • <$transclude $tiddler="$:/core/icon" size="3em"/> with the possibility to use named-parameters, if there are many of them.

I tw 5.3.x the \function is my favorite thing for half a dozen reasons. If your count filter is in a function name it will be evaluated before being used as a parameter valuate.

You did not share your count macros content but change them to functions based only on a filter and it should work as expected.

  • only the first value from a function is used.

Thanks I will try it out when I get home :+1:

Thanks TW_Tones that worked fine - graph is now showing live data from my TiddlyWiki, graph adjusts as I change a tiddler rating.

:+1:

Screenshot from 2023-11-24 16-11-40

I am really liking this way of getting simple graph functionality into a plugin without having dependencies on graphics plugins. Just design your graph as an SVG graphics file, make the height of the bars an attribute but over-ride it with a style statement that takes on vars from Tiddywiki and voila! The nice thing about the attributes having ā€˜placeholderā€™ values (attributes) is that the graph will display something sensible even if it is used without passing any parameters to it - it has a default appearance and a dynamic one.

After the valid points about polarization I thought a visual indication of the distribution would be helpful.

This graph is intended for the sidebar tab for my new ratings plugin (still in development), I need to add a scaling on the Y scale so that it can cope as more Tiddlers receive a rating. I donā€™t think I will bother just yet with a numeric Y scale - itā€™s main function is to show the relative distribution.


<svg width="300" height="300" class="tc-image-bts-phone-landscape-fill tc-image-button" viewBox="0 0 300 300">
<g id="graphs1" transform="scale(2, -2) translate(4, -50)">
<rect x="4"   y="0" width="110" height="1" style="fill:#111; opacity:4%"/>
<rect x="4" y="10" width="110" height="1" style="fill:#111; opacity:4%"/>
<rect x="4" y="20" width="110" height="1" style="fill:#111; opacity:4%"/>
<rect x="4" y="30" width="110" height="1" style="fill:#111; opacity:4%"/>
<rect x="4" y="40" width="110" height="1" style="fill:#111; opacity:4%"/>
<rect x="10" y="0" width="5" height="10" style=`fill:#888; height:$(b1)$; opacity:80%`/>
<rect x="20" y="0" width="5" height="34" style=`fill:#A7B; height:$(b2)$; opacity:80%`/>
<rect x="30" y="0" width="5" height="66" style=`fill:#888; height:$(b3)$; opacity:80%`/>
<rect x="40" y="0" width="5" height="28" style=`fill:#A7B; height:$(b4)$; opacity:80%`/>
<rect x="50" y="0" width="5" height="70" style=`fill:#888; height:$(b5)$; opacity:80%`/>
<rect x="60" y="0" width="5" height="68" style=`fill:#A7B; height:$(b6)$; opacity:80%`/>
<rect x="70" y="0" width="5" height="46" style=`fill:#888; height:$(b7)$; opacity:80%`/>
<rect x="80" y="0" width="5" height="14" style=`fill:#A7B; height:$(b8)$; opacity:80%`/>
<rect x="90" y="0" width="5" height="60" style=`fill:#888; height:$(b9)$; opacity:80%`/>
<rect x="100" y="0" width="5" height="50" style=`fill:#A7B; height:$(b10)$; opacity:80%`/>
<rect x="12" y="-3" width="1" height="1" style="fill:#111; opacity:40%"/>
<rect x="22" y="-3" width="1" height="1" style="fill:#111; opacity:40%"/>
<rect x="32" y="-3" width="1" height="1" style="fill:#111; opacity:40%"/>
<rect x="42" y="-3" width="1" height="1" style="fill:#111; opacity:40%"/>
<rect x="52" y="-3" width="1" height="1" style="fill:#111; opacity:40%"/>
<rect x="62" y="-3" width="1" height="1" style="fill:#111; opacity:40%"/>
<rect x="72" y="-3" width="1" height="1" style="fill:#111; opacity:40%"/>
<rect x="82" y="-3" width="1" height="1" style="fill:#111; opacity:40%"/>
<rect x="92" y="-3" width="1" height="1" style="fill:#111; opacity:40%"/>
<rect x="102" y="-3" width="1" height="1" style="fill:#111; opacity:40%"/>
</g>
<g id="graphs2" transform="scale(2, 2) translate(4, 60)">
<text x="12" y="0" font-size="6" text-anchor="middle">10</text>
<text x="22" y="0" font-size="6" text-anchor="middle" >20</text>
<text x="32" y="0" font-size="6" text-anchor="middle" >30</text>
<text x="42" y="0" font-size="6" text-anchor="middle" >40</text>
<text x="52" y="0" font-size="6" text-anchor="middle" >50</text>
<text x="62" y="0" font-size="6" text-anchor="middle" >60</text>
<text x="72" y="0" font-size="6" text-anchor="middle" >70</text>
<text x="82" y="0" font-size="6" text-anchor="middle" >80</text>
<text x="92" y="0" font-size="6" text-anchor="middle" >90</text>
<text x="102" y="0" font-size="6" text-anchor="middle" >100</text>
</g>
</svg>

I actually found out about this graph possibility when I started investigating how the Journal icon magically shows the day of the month. I wondered whether this avenue ( the fact that Tiddlywiki parses SVG and so can inject variable values) was fully highlighted in the doc or this discussion forum and searching for SVG I found your post [Crowdsource] Using Inkscape SVGā€™s with TiddlyWiki - I wondered whether my post here, re-edited might be better placed on that thread than this one? I will happily move if you think itā€™s a good example to add to your thread, I quoteā€¦

  • Creating SVGs that once in tiddlywiki then can respond to content or parameters in TiddlyWiki.
  • Creating SVG favicons and when to use raster formats like png
  • Acknowledgements and licencing
  • Changing color programmatically
1 Like

Nice work @jonnie45 I think you could start you own discussion topic to share your approach. But you can always link to and from different topics which helps people reseaching in talk.tiddlywiki.

  • Just a little more information about giving it the parameters would make this useful for a lot of people.
  • If you go to control Panel > Info > Basics and scroll to the bottom there are some tiddlers counts, those numbers would be good example data.

One thing that stands out of course is the repitition needed to represent the svg. I canā€™t help but think we could simplify it some how with some tiddlywiki script, list widgets or something. As you may be aware SVG is a html standard, and HTML can be imbeded inside tiddlywiki content, in fact tiddlywiki scripts are always ultimatly rendered in HTML.

  • I will see if I can experiment with something today.

Noice work and thanks for sharing back

Sorry TW_Tones - I accidentally ticked my response to your solution so I actually awarded myself with the kudos due to you which is very cheeky I think - :rofl: - I have moved it now. As they sayā€¦ā€œcredit where credit is dueā€.

Can anyone explain this reference height:$(b4)$; and the others $( )$

  • I can also make the data into a list If I understood this.

Here I used TiddlyWiki script to reduce the verbosity. If I had tiddlers or a filter to determine the data we could automate that as well.

  • It illustrates how we could ā€œparametise and automate it furtherā€
<svg width="600" height="600" class="tc-image-bts-phone-landscape-fill tc-image-button" viewBox="0 0 300 300">
<g id="graphs1" transform="scale(2, -2) translate(4, -50)">
<$list filter="[range[10],[40],[10]]" variable=n>
<rect x="4"   y=<<n>> width="110" height="1" style="fill:#111; opacity:4%"/>
</$list>
<rect x="10" y="0" width="5" height="10" style=`fill:#888; height:$(b1)$; opacity:80%`/>
<rect x="20" y="0" width="5" height="34" style=`fill:#A7B; height:$(b2)$; opacity:80%`/>
<rect x="30" y="0" width="5" height="66" style=`fill:#888; height:$(b3)$; opacity:80%`/>
<rect x="40" y="0" width="5" height="28" style=`fill:#A7B; height:$(b4)$; opacity:80%`/>
<rect x="50" y="0" width="5" height="70" style=`fill:#888; height:$(b5)$; opacity:80%`/>
<rect x="60" y="0" width="5" height="68" style=`fill:#A7B; height:$(b6)$; opacity:80%`/>
<rect x="70" y="0" width="5" height="46" style=`fill:#888; height:$(b7)$; opacity:80%`/>
<rect x="80" y="0" width="5" height="14" style=`fill:#A7B; height:$(b8)$; opacity:80%`/>
<rect x="90" y="0" width="5" height="60" style=`fill:#888; height:$(b9)$; opacity:80%`/>
<rect x="100" y="0" width="5" height="50" style=`fill:#A7B; height:$(b10)$; opacity:80%`/>
<$list filter="[range[12],[102],[10]]" variable=n>
<rect x=<<n>> y="-3" width="1" height="1" style="fill:#111; opacity:40%"/>
</$list>
</g>
<g id="graphs2" transform="scale(2, 2) translate(4, 60)">
<$list filter="[range[10],[100],[10]]" variable=n>
<text x={{{ [<n>add[2]] }}} y="0" font-size="6" text-anchor="middle"><<n>></text>
</$list>
</g>
</svg>

Got it, its inside back ticks ! But where is the value coming from ?

Hi TW_Tones

First an example of one of the functions.


\function count80to90()
[all[tiddlers]!is[system]has:field[rating3]get[rating3]compare:integer:gt[80]compare:integer:lteq[90]count[]]
\end

Then the following with a line of trace code that will be removed -the one that shows the values as text
The transclude of the SVG tiddler is the only line that would remain inside the filter after development.


\define drawGraph2(b1, b2, b3, b4, b5, b6, b7, b8, b9, b10)

<$list filter="[all[current]]">
{{$:/plugins/jonnie45/RateTiddlers/images/graph3}}
$(b1)$ $(b2)$ $(b3)$ $(b4)$ $(b5)$ $(b6)$ $(b7)$ $(b8)$ $(b9)$ $(b10)$ 
</$list>
\end

And then the code to setup the variables b1 to b10 and then invoke the above to create graph at the bottom of the sidebar tab used for the rating plugin

Distribution Of Ratings 

<br>

<$list filter="[]">
<$let b1=<<count1to10>> b2=<<count10to20>> b3=<<count20to30>> b4=<<count30to40>> b5=<<count40to50>> b6=<<count50to60>> b7=<<count60to70>> b8=<<count70to80>> b9=<<count80to90>> b10=<<count90to100>> >
<<drawGraph2>>
</$let>
</$list>

It will probably benefit from refinement but it seems to be working fine for now.
I was a bit concerned about the rather simple minded way of collecting the data for the ten bars of the graph so at some point I will be asking if anyone knows how to collect these items within one pass of all tiddlers. However I donā€™t experience any lag on my laptop so performance is not an immediate concern but I anticipate needing to smarten it up a bit.

All of the above appears in the plugin sidebar tab.